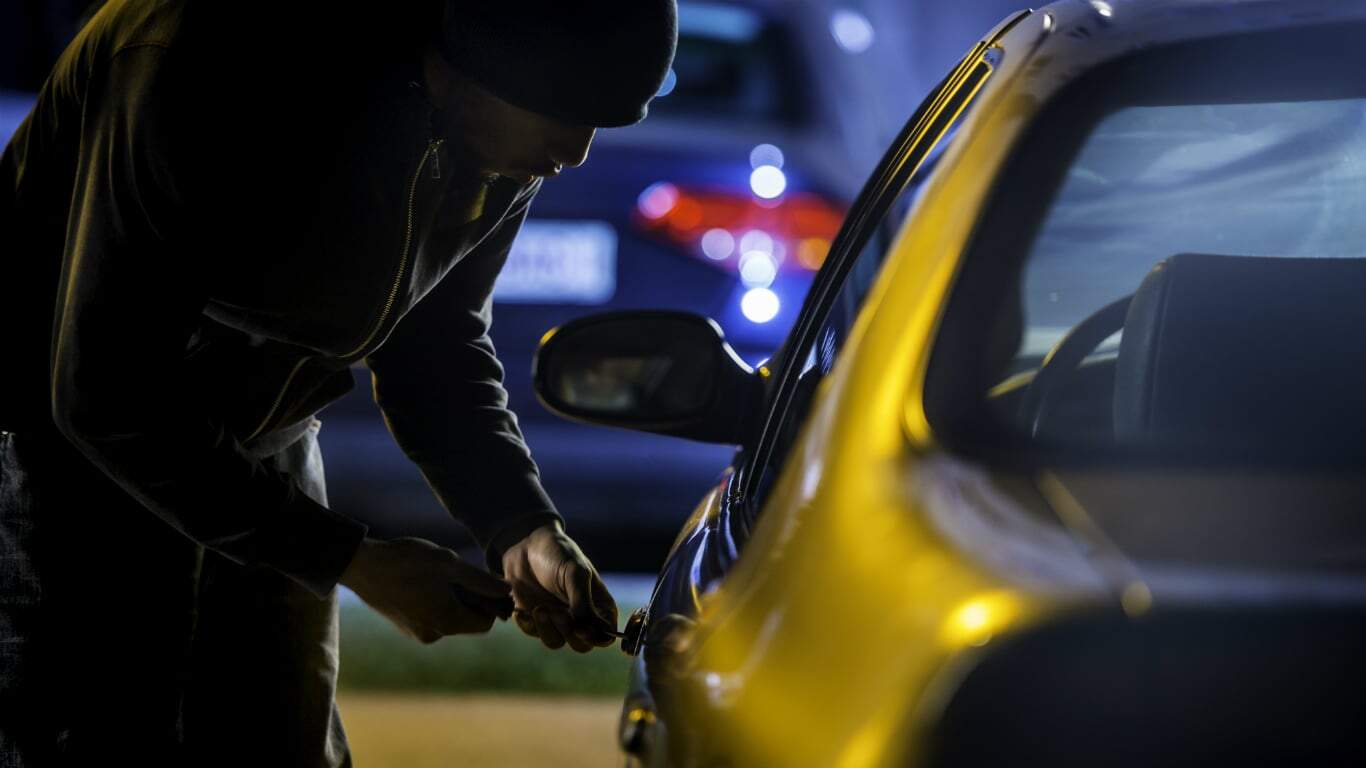
These States Have the Highest Car Theft Rates in America
Car theft is more common than most people realize, and in some parts of the country, it’s happening at an alarming rate. In fact, a vehicle is stolen in the U.S. about every 30 seconds. While it can happen anywhere, certain states see far more thefts than others, making them much riskier places to own a car.
In this slideshow, we break down the states where your car is most likely to be stolen, based on the latest available data. Using theft rates per 100,000 residents, these rankings highlight where drivers face the highest risk and just how wide the gap is between the safest and most vulnerable states.
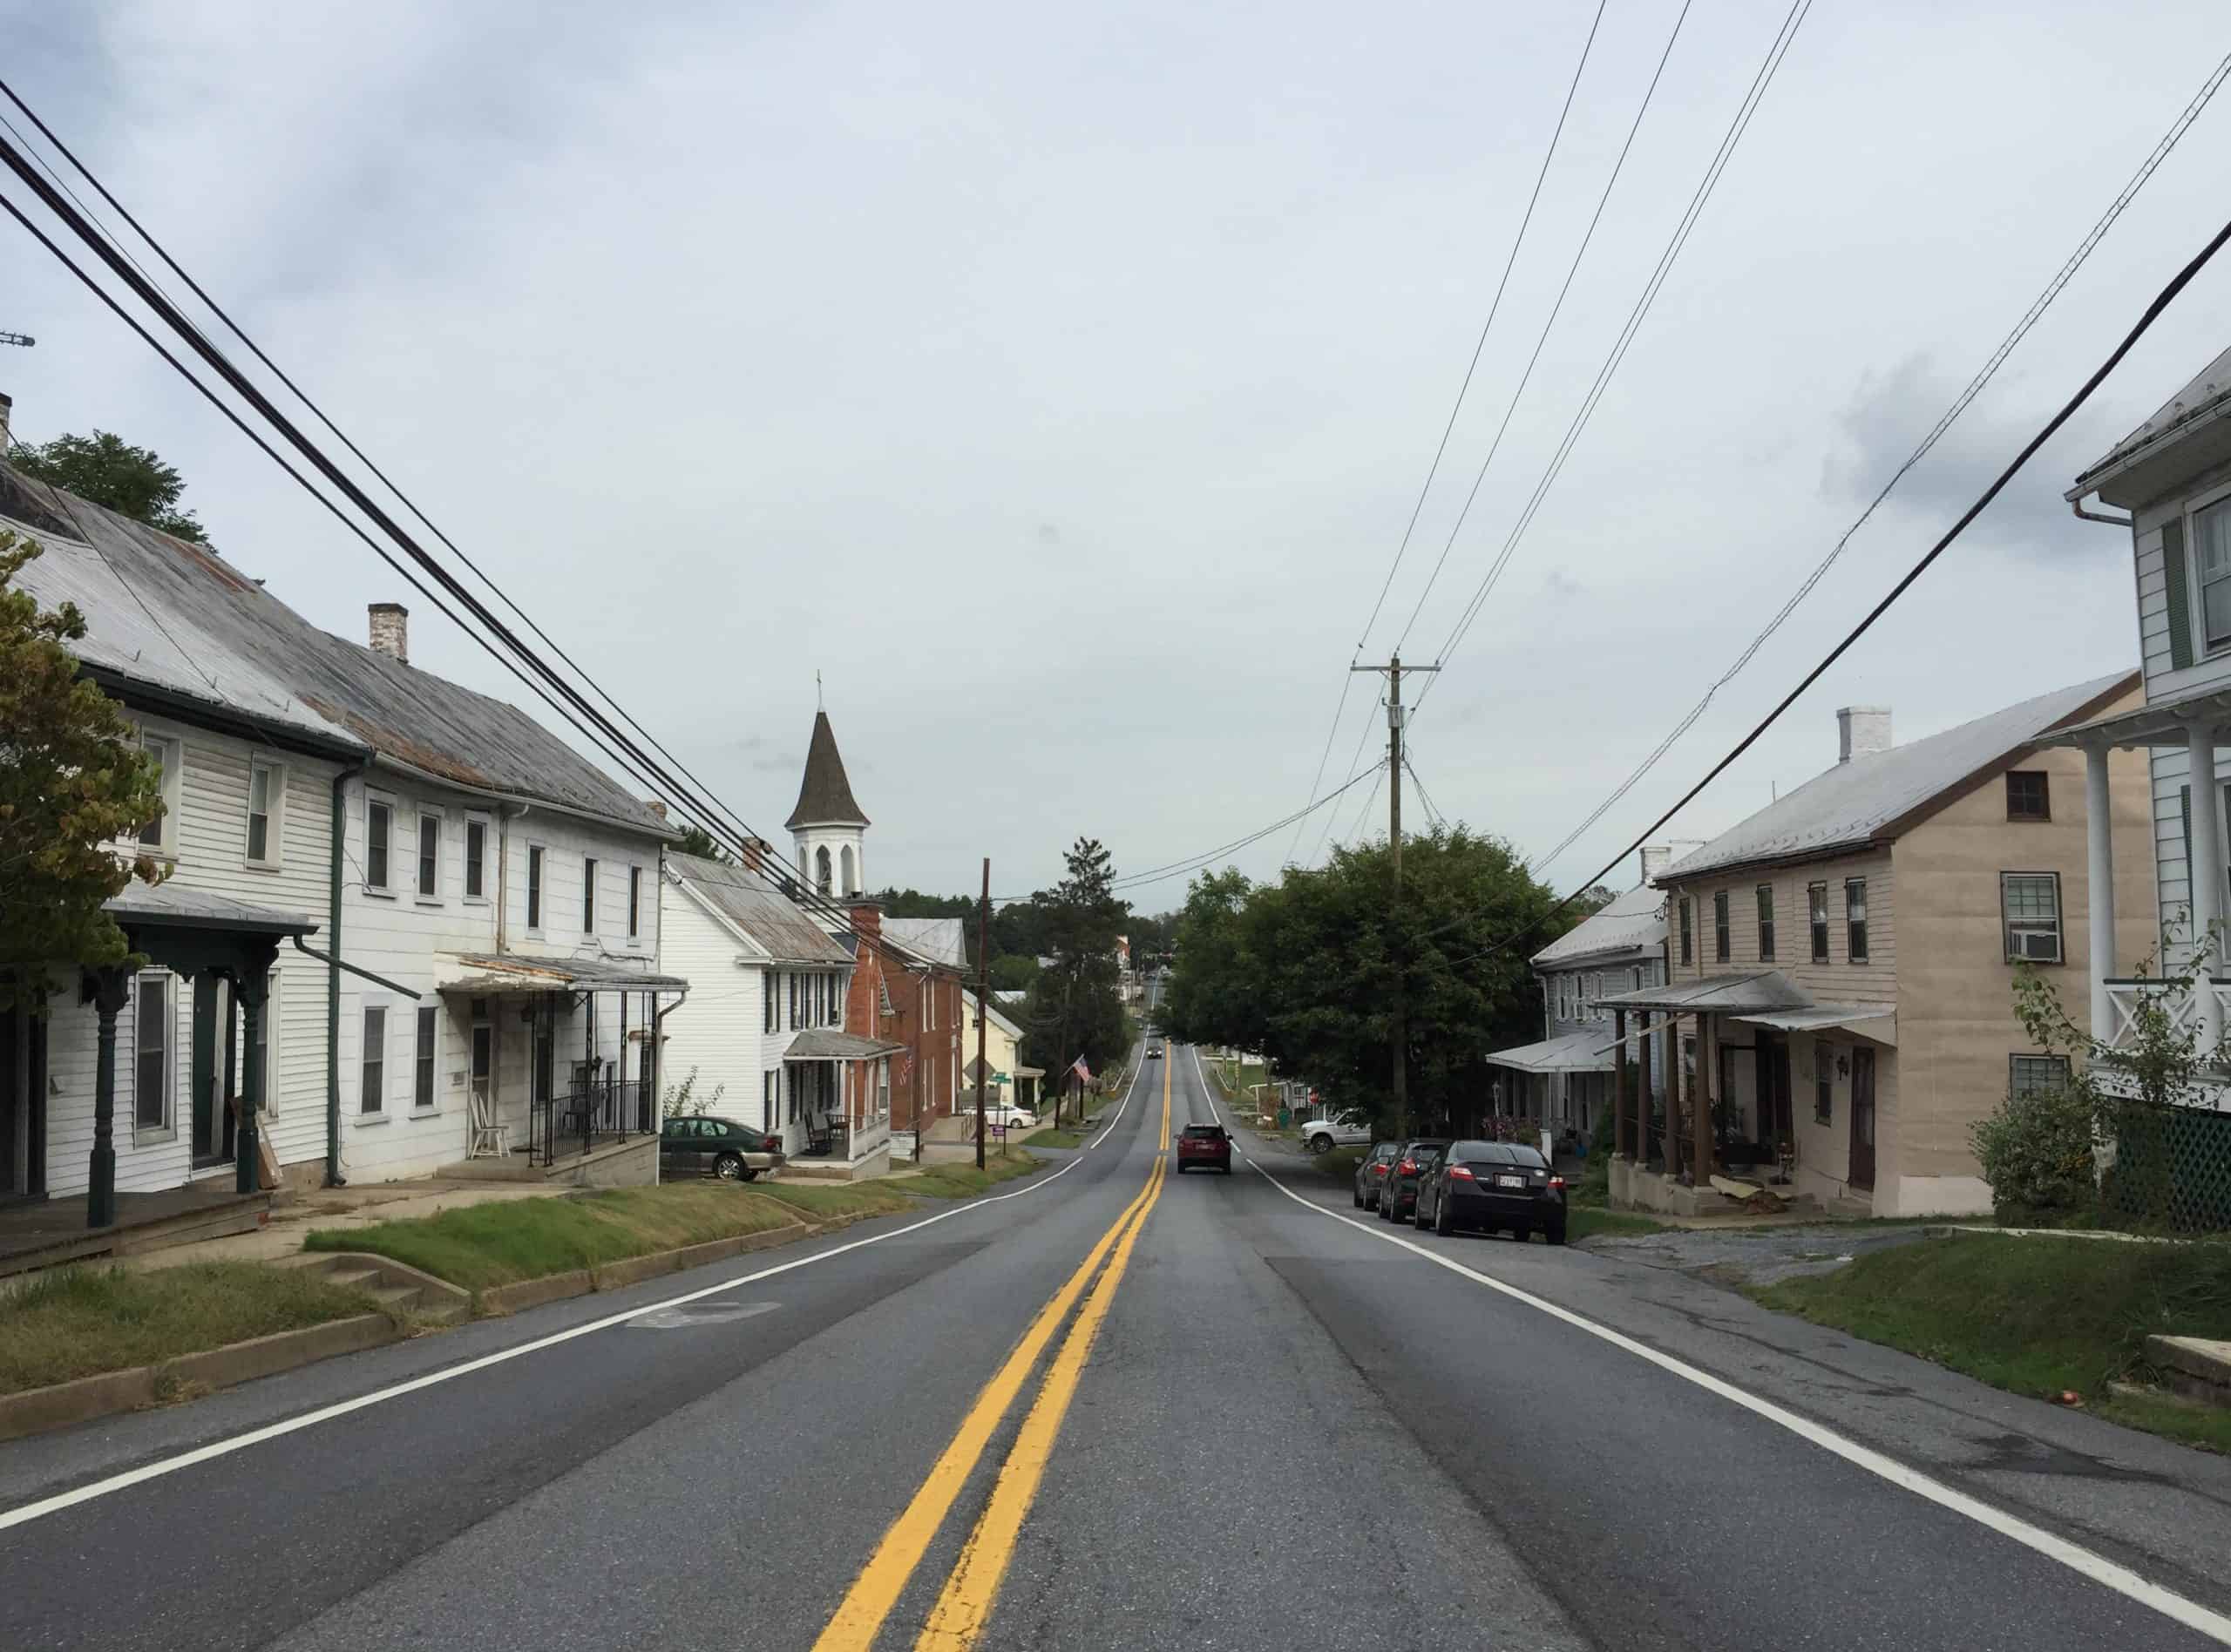
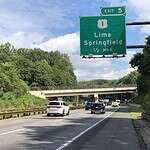
50. New Hampshire
Motor-vehicle theft rate in 2022: 53.8 incidents per 100,000 people
Total, known motor-vehicle thefts in 2022: 750 — the fewest of 50 states (0.1% of all U.S. car thefts)
Registered light-duty vehicles in state: 99.2 for every 100 people (1,383,700 total)
State population: 1,395,200 — 10th smallest of 50 states (0.4% of total U.S. population)
49. Maine
Motor-vehicle theft rate in 2022: 68.1 incidents per 100,000 people
Total, known motor-vehicle thefts in 2022: 944 — 3rd fewest of 50 states (0.1% of all U.S. car thefts)
Registered light-duty vehicles in state: 89.2 for every 100 people (1,236,000 total)
State population: 1,385,300 — 9th smallest of 50 states (0.4% of total U.S. population)
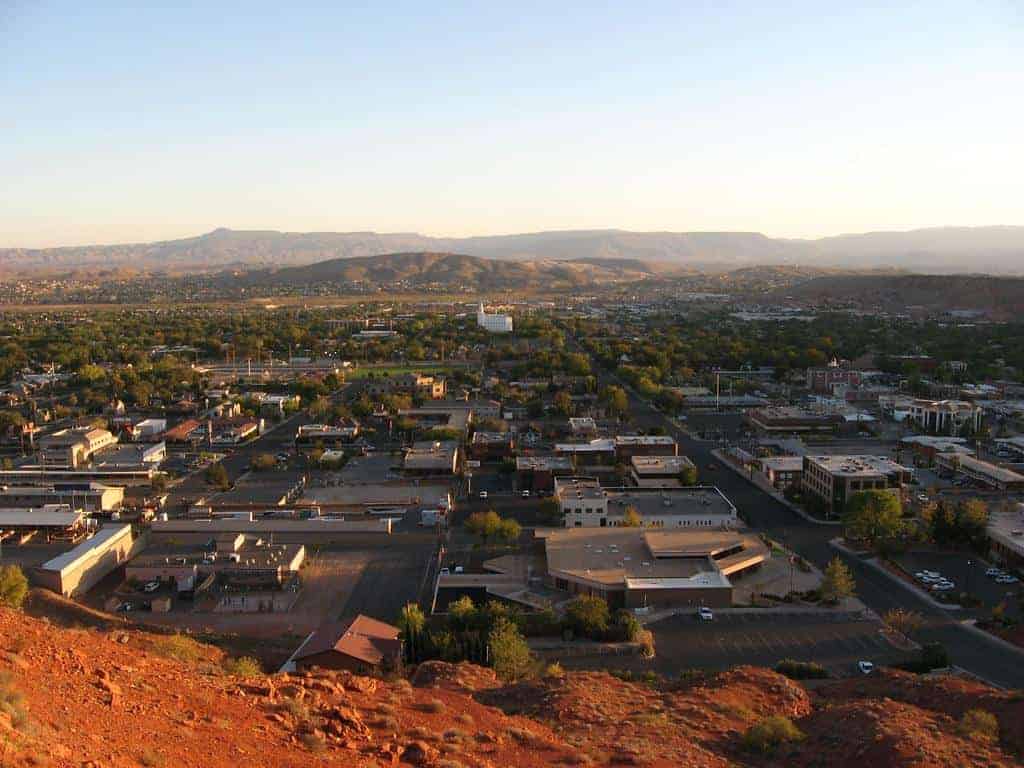
48. Idaho
Motor-vehicle theft rate in 2022: 91.1 incidents per 100,000 people
Total, known motor-vehicle thefts in 2022: 1,766 — 6th fewest of 50 states (0.2% of all U.S. car thefts)
Registered light-duty vehicles in state: 101.8 for every 100 people (1,974,600 total)
State population: 1,939,000 — 13th smallest of 50 states (0.6% of total U.S. population)
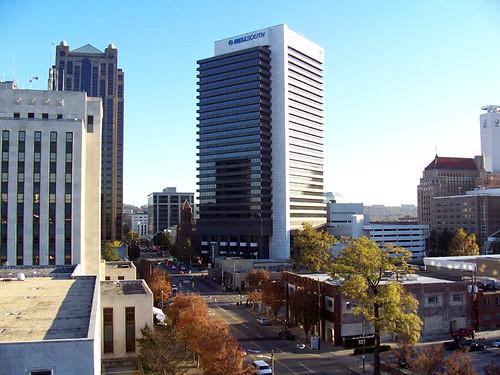
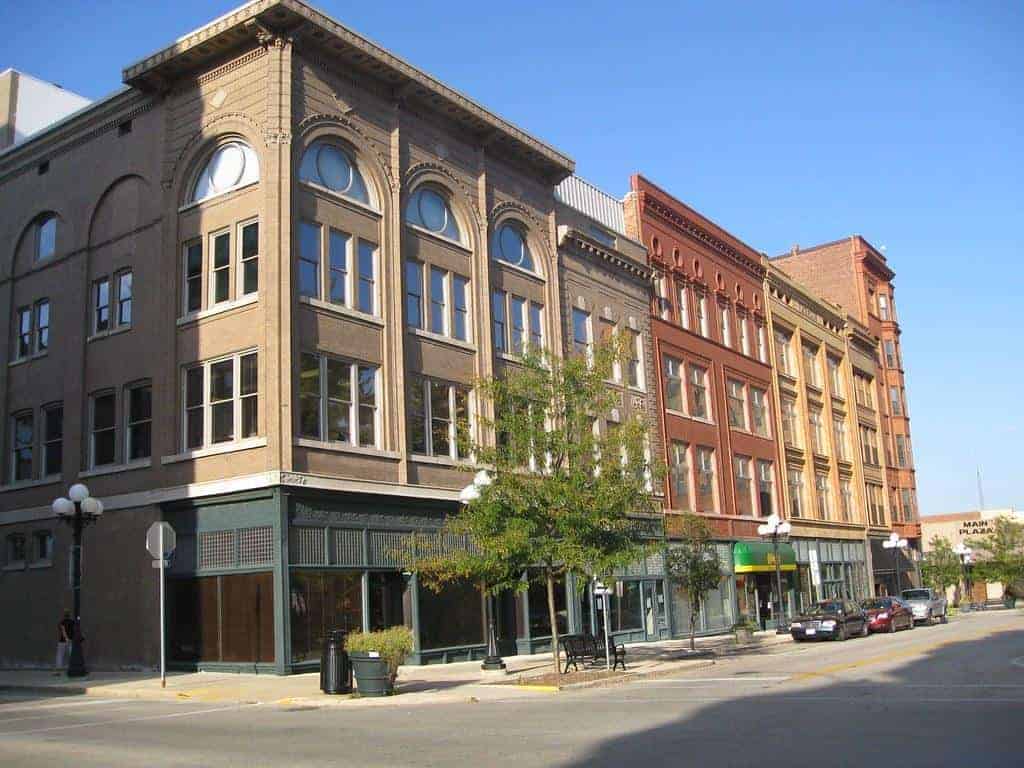
47. Massachusetts
Motor-vehicle theft rate in 2022: 101.5 incidents per 100,000 people
Total, known motor-vehicle thefts in 2022: 7,084 — 18th fewest of 50 states (0.7% of all U.S. car thefts)
Registered light-duty vehicles in state: 78.6 for every 100 people (5,491,100 total)
State population: 6,982,000 — 16th largest of 50 states (2.1% of total U.S. population)
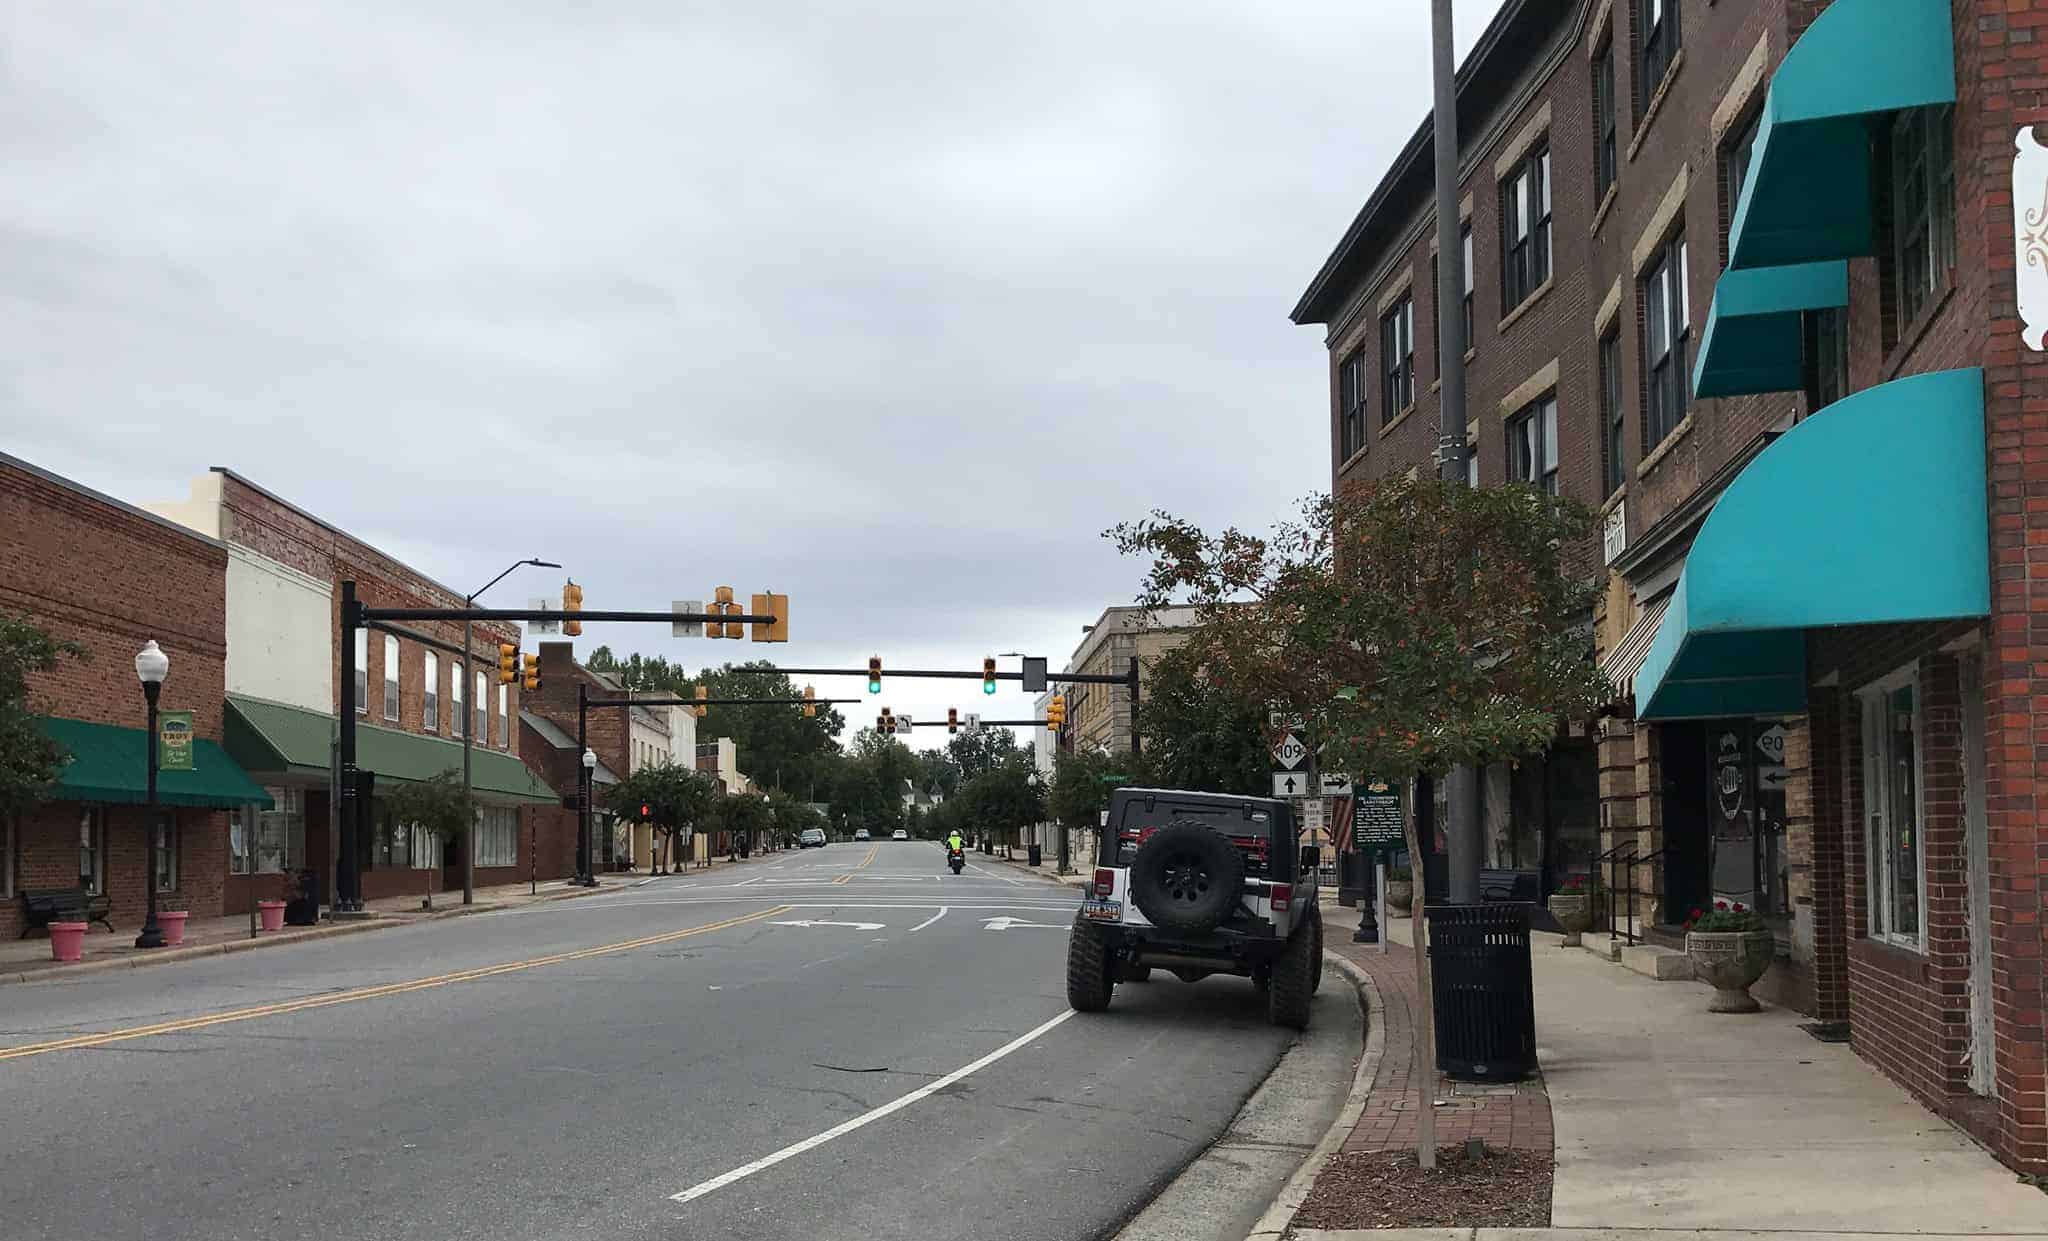
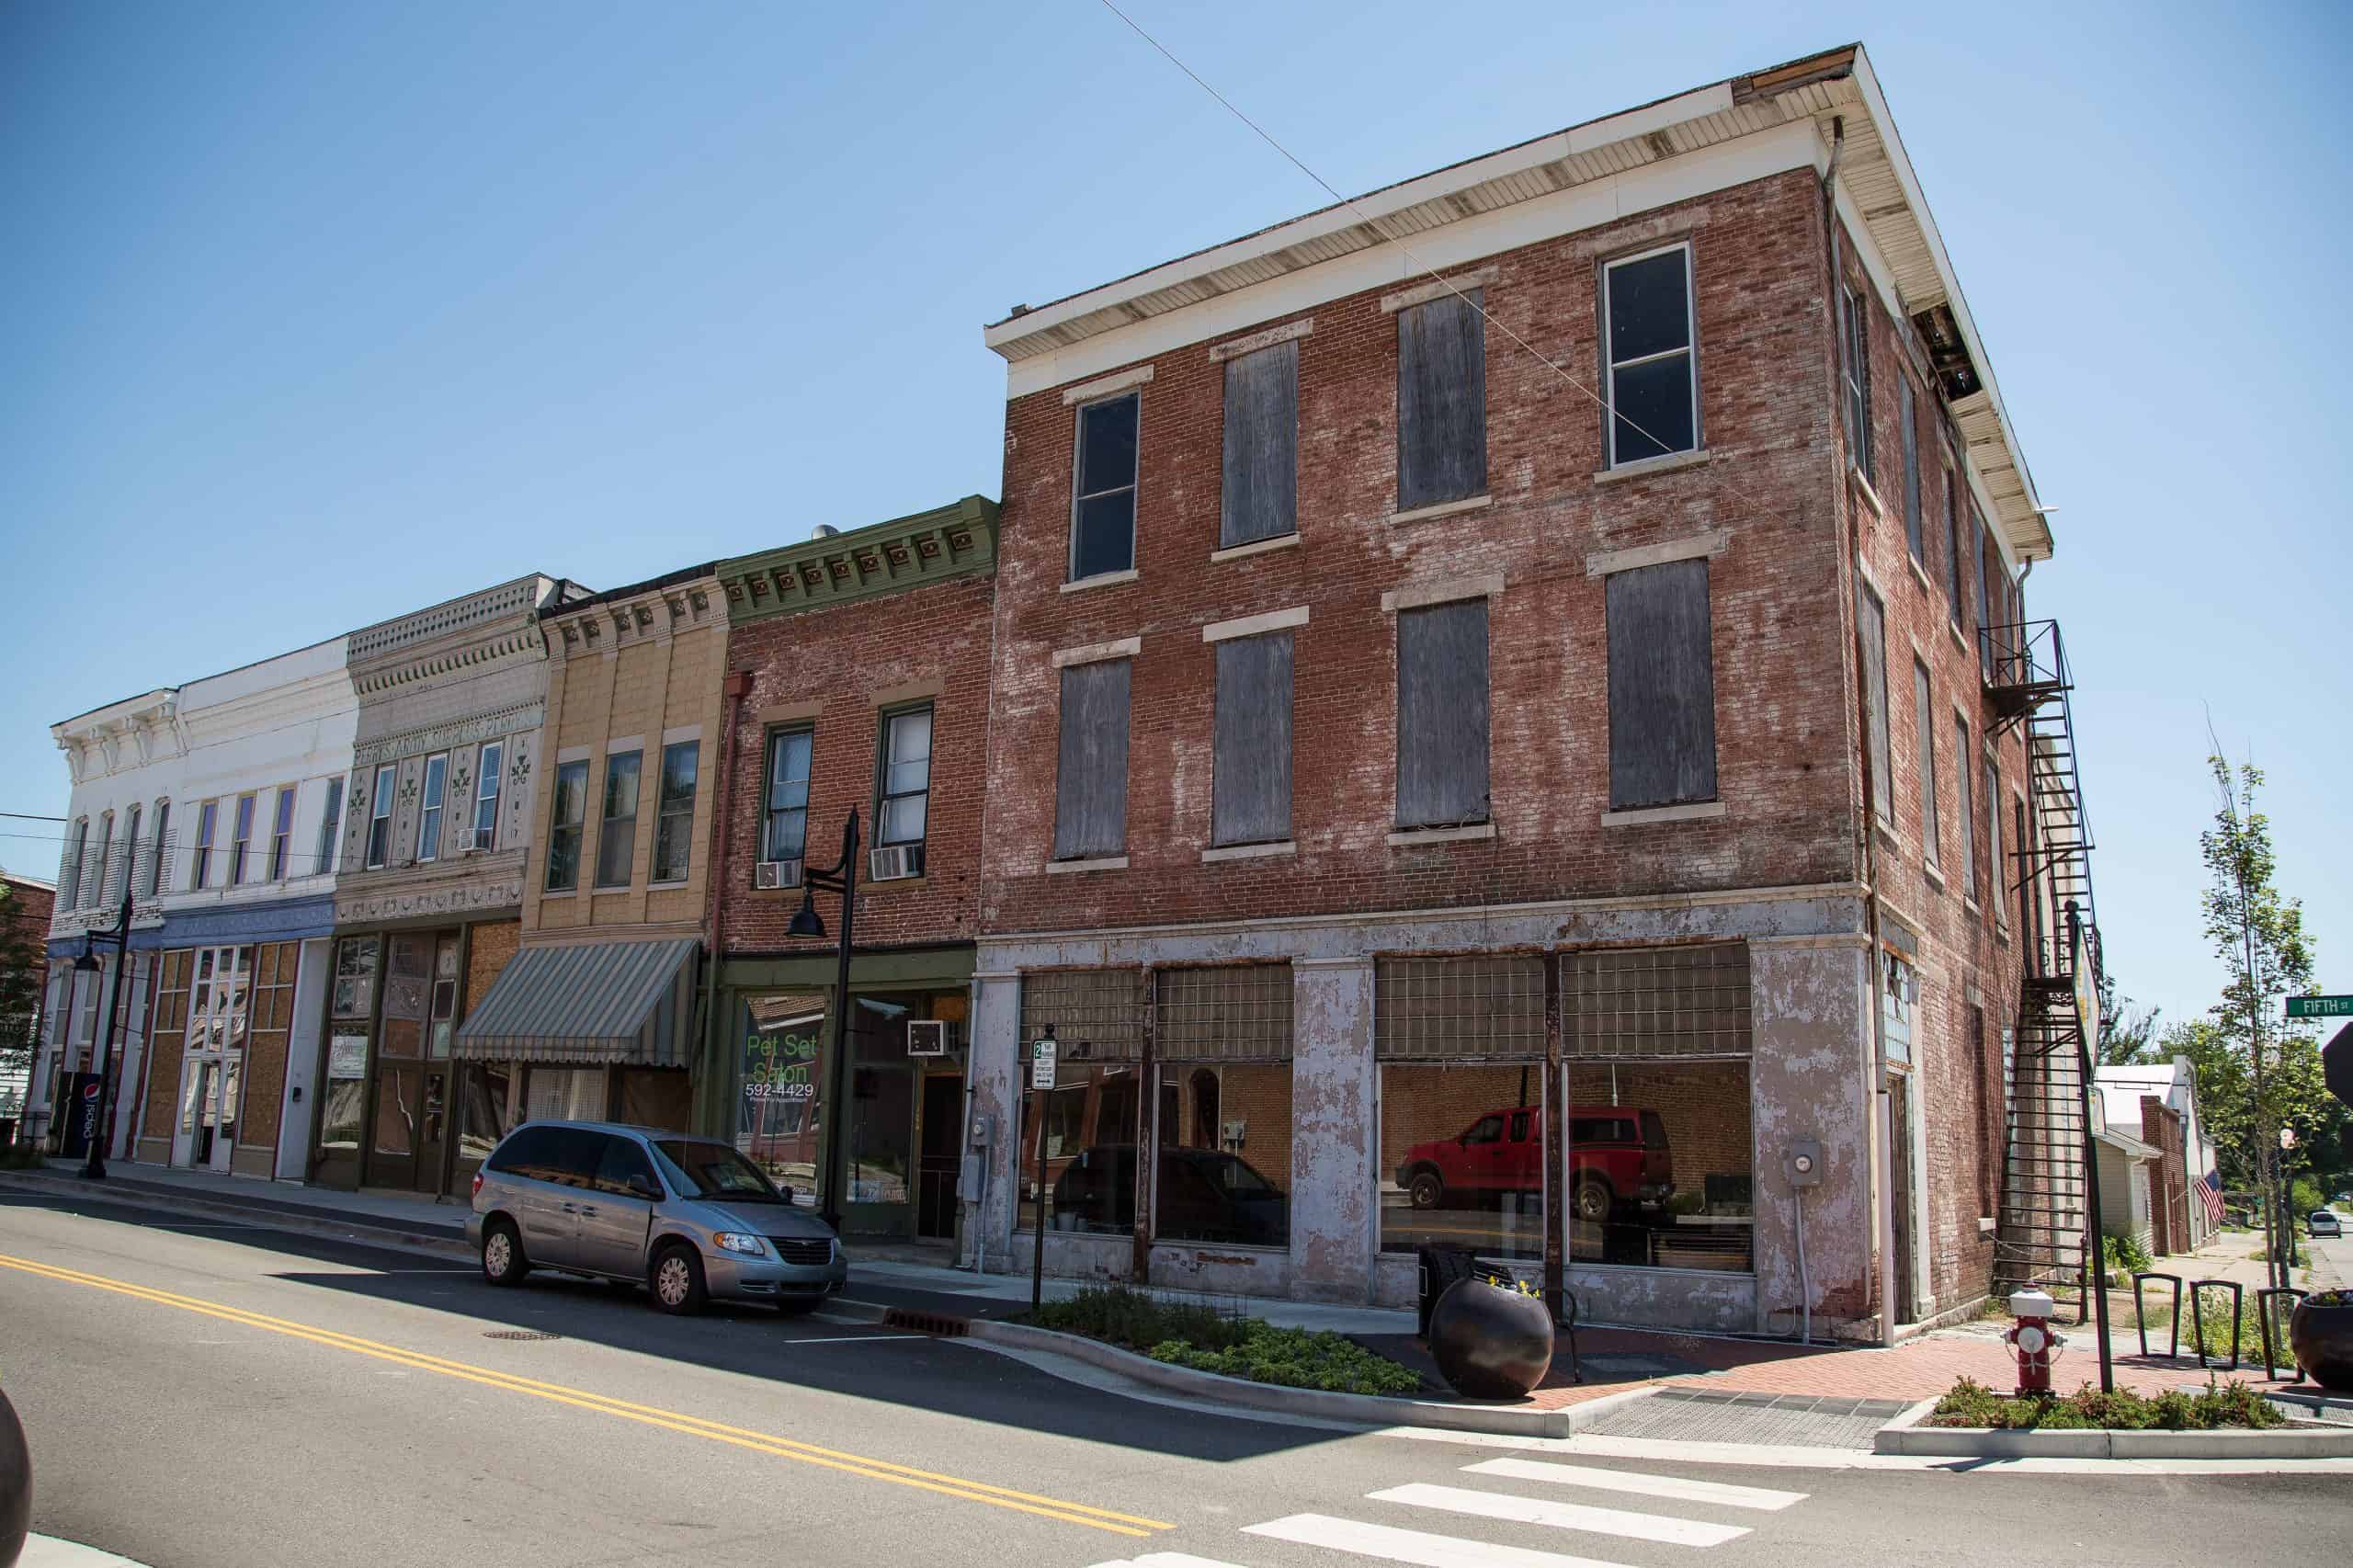
46. West Virginia
Motor-vehicle theft rate in 2022: 115.3 incidents per 100,000 people
Total, known motor-vehicle thefts in 2022: 2,046 — 10th fewest of 50 states (0.2% of all U.S. car thefts)
Registered light-duty vehicles in state: 85.1 for every 100 people (1,510,900 total)
State population: 1,775,200 — 12th smallest of 50 states (0.5% of total U.S. population)
45. Wyoming
Motor-vehicle theft rate in 2022: 132.4 incidents per 100,000 people
Total, known motor-vehicle thefts in 2022: 770 — 2nd fewest of 50 states (0.1% of all U.S. car thefts)
Registered light-duty vehicles in state: 112.3 for every 100 people (652,900 total)
State population: 581,400 — the smallest of 50 states (0.2% of total U.S. population)
44. New York
Motor-vehicle theft rate in 2022: 143.9 incidents per 100,000 people
Total, known motor-vehicle thefts in 2022: 28,323 — 9th most of 50 states (2.8% of all U.S. car thefts)
Registered light-duty vehicles in state: 57.5 for every 100 people (11,318,600 total)
State population: 19,677,200 — 4th largest of 50 states (5.9% of total U.S. population)
43. Vermont
Motor-vehicle theft rate in 2022: 160.6 incidents per 100,000 people
Total, known motor-vehicle thefts in 2022: 1,039 — 4th fewest of 50 states (0.1% of all U.S. car thefts)
Registered light-duty vehicles in state: 91.7 for every 100 people (593,100 total)
State population: 647,100 — 2nd smallest of 50 states (0.2% of total U.S. population)
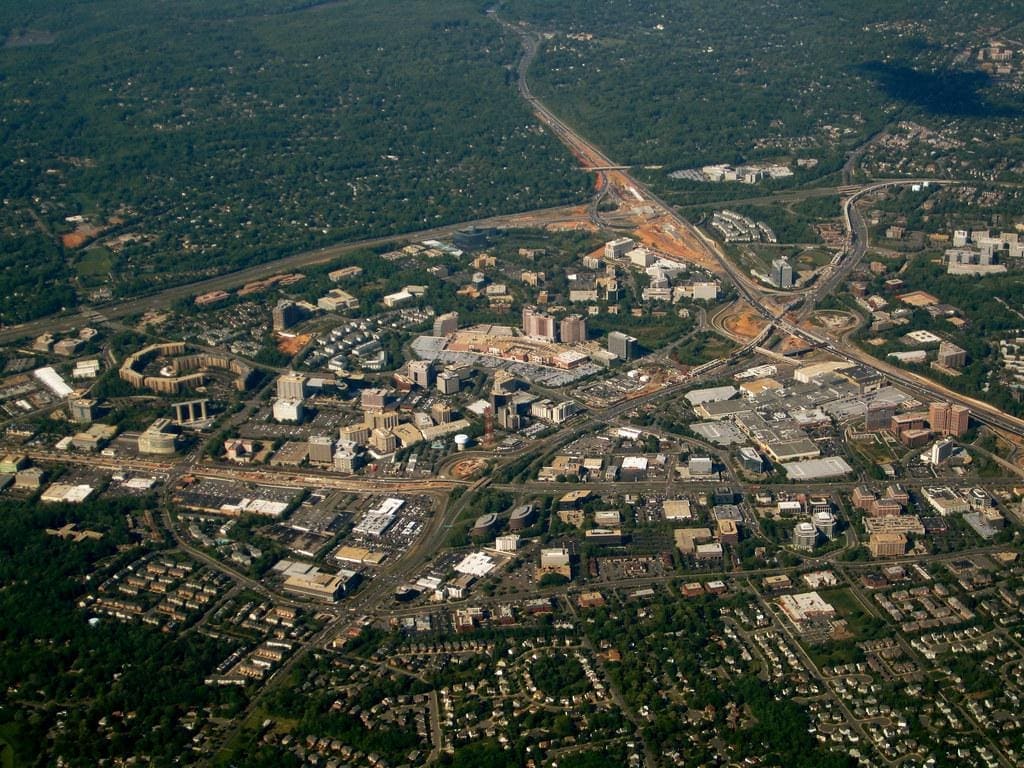
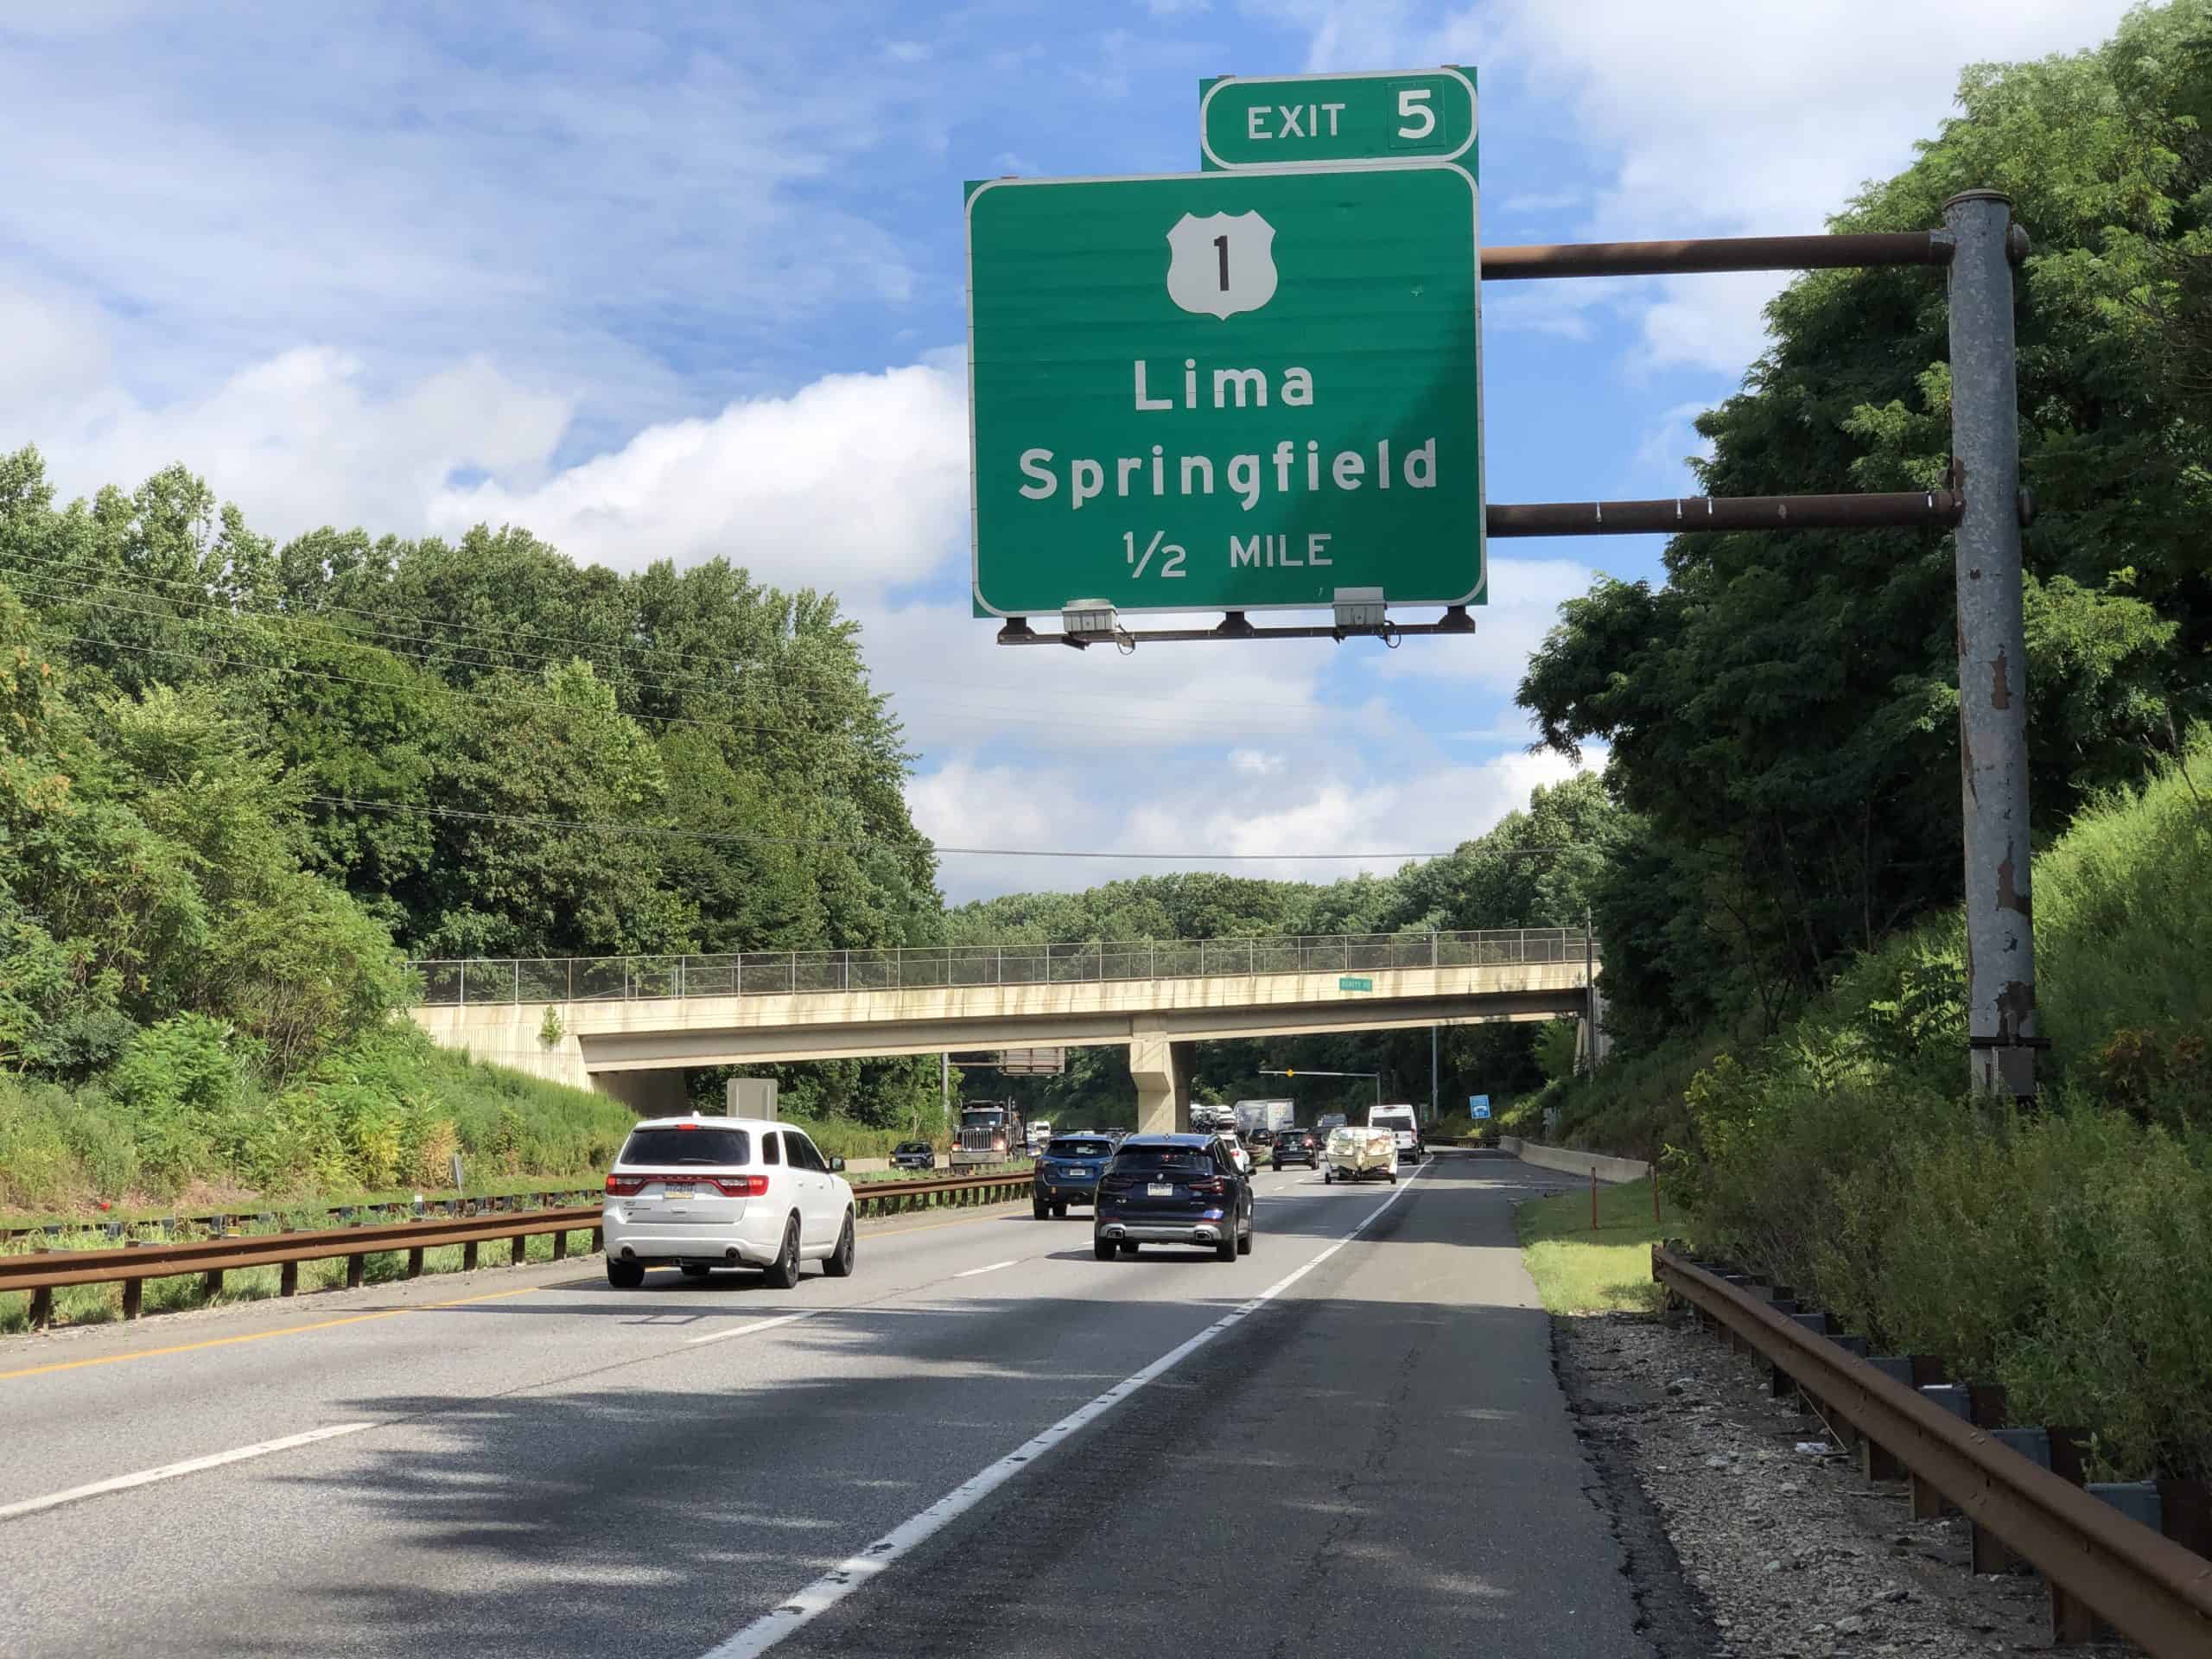
42. Virginia
Motor-vehicle theft rate in 2022: 164.2 incidents per 100,000 people
Total, known motor-vehicle thefts in 2022: 14,256 — 23rd most of 50 states (1.4% of all U.S. car thefts)
Registered light-duty vehicles in state: 88.9 for every 100 people (7,723,500 total)
State population: 8,683,600 — 12th largest of 50 states (2.6% of total U.S. population)
41. Rhode Island
Motor-vehicle theft rate in 2022: 164.2 incidents per 100,000 people
Total, known motor-vehicle thefts in 2022: 1,796 — 7th fewest of 50 states (0.2% of all U.S. car thefts)
Registered light-duty vehicles in state: 80.2 for every 100 people (877,600 total)
State population: 1,093,700 — 7th smallest of 50 states (0.3% of total U.S. population)
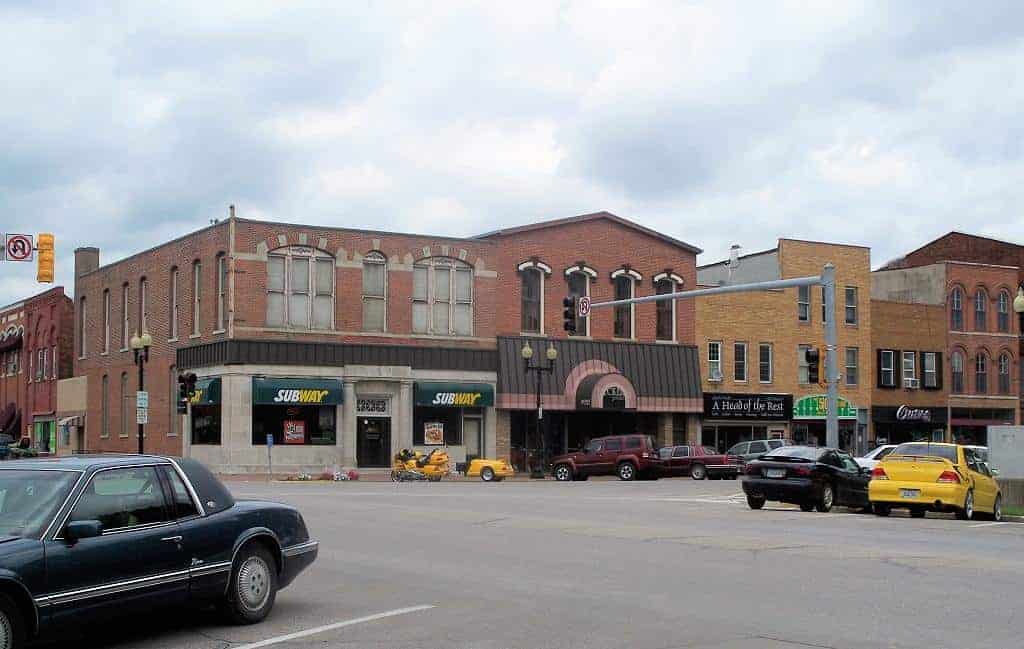
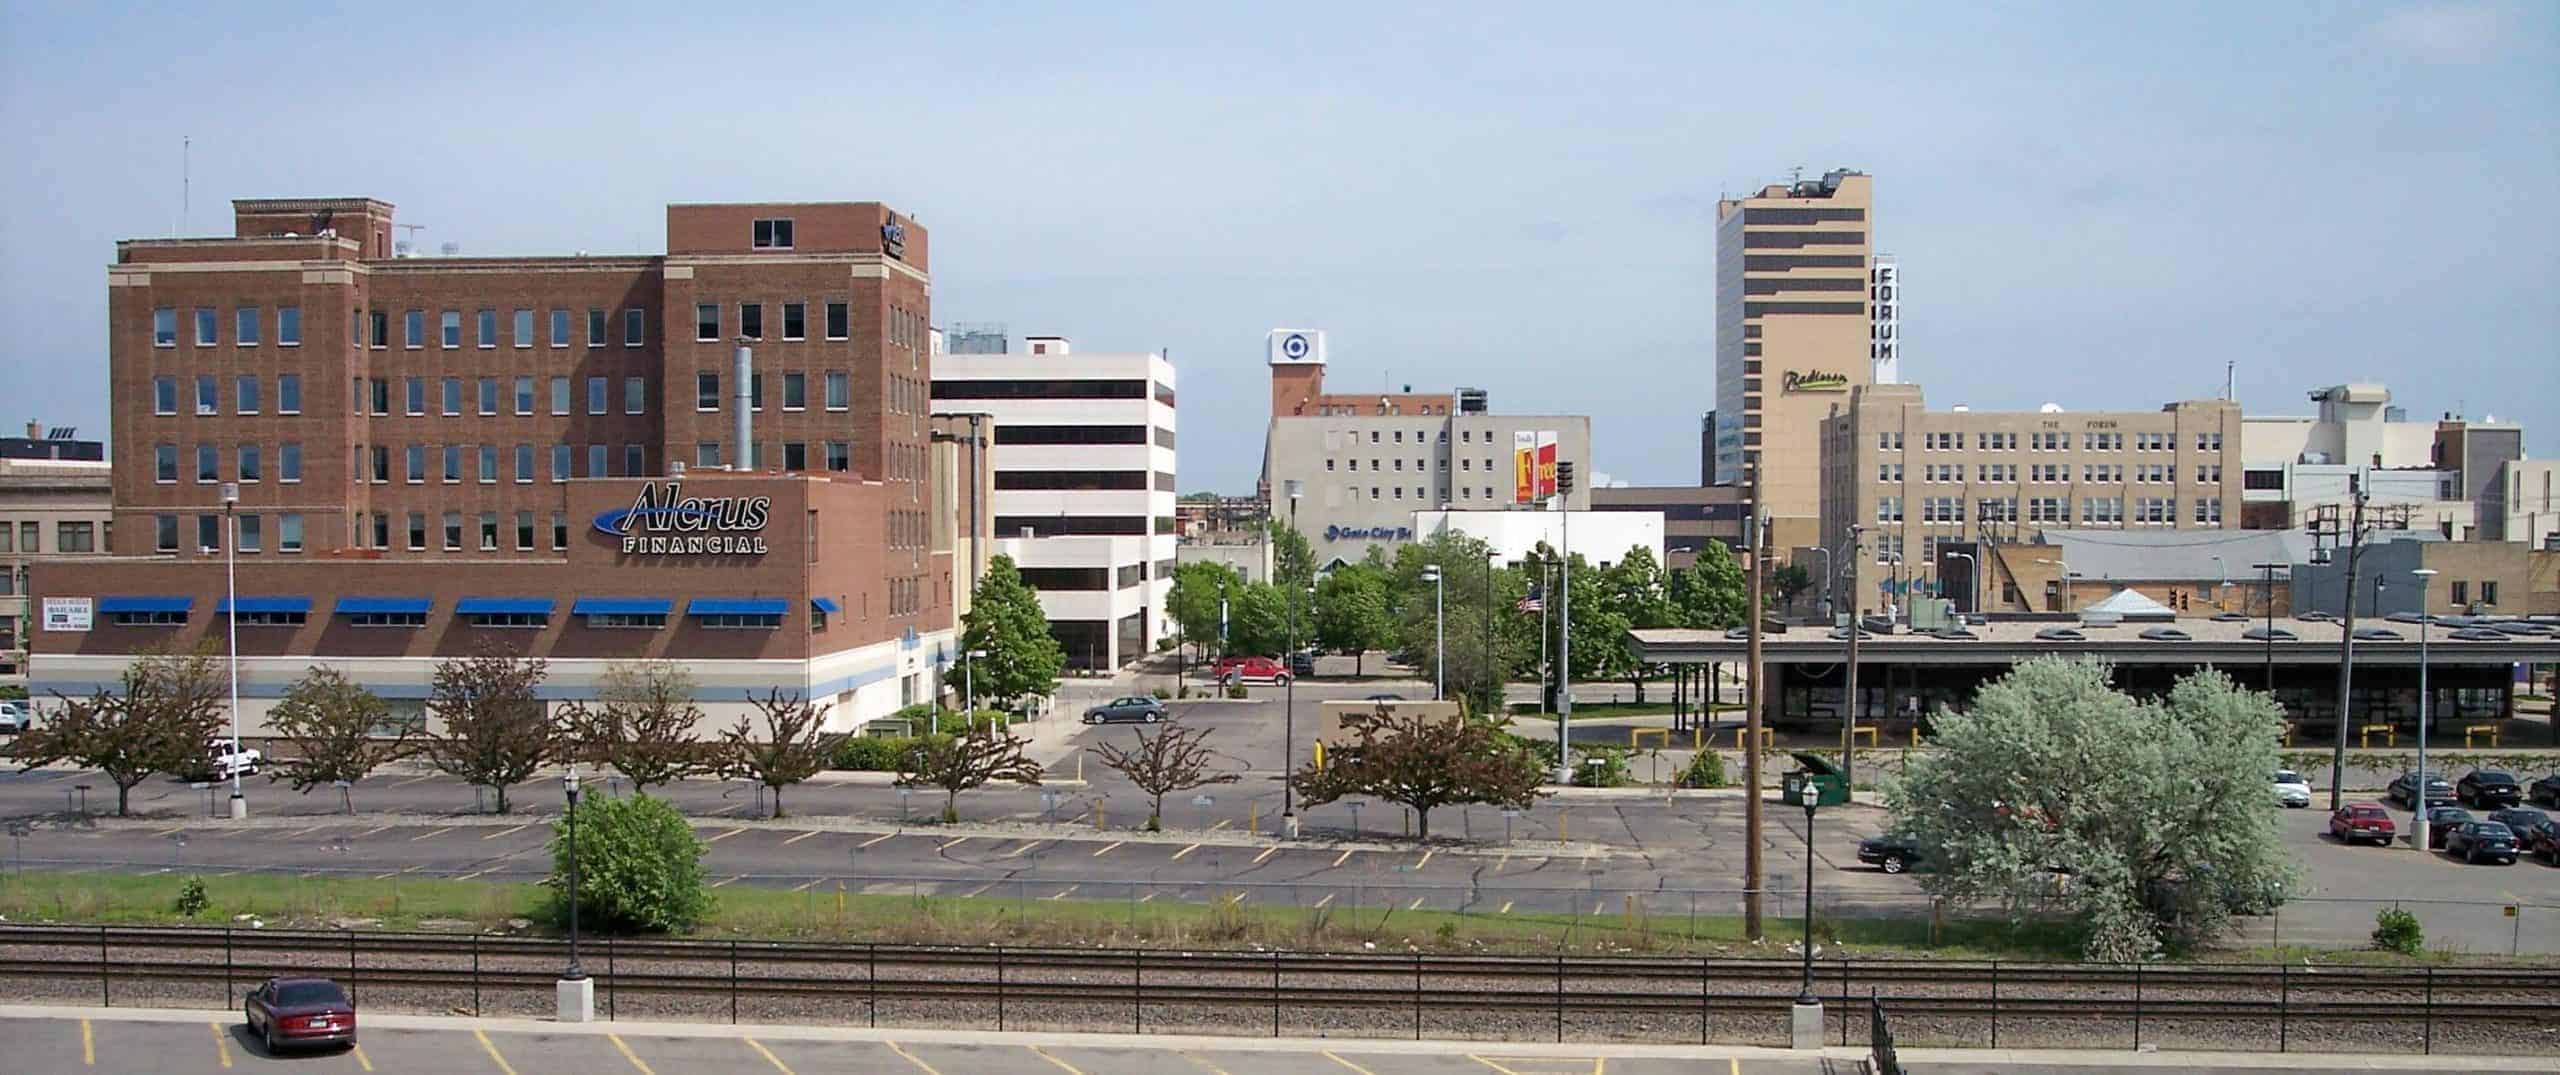
40. Iowa
Motor-vehicle theft rate in 2022: 168.1 incidents per 100,000 people
Total, known motor-vehicle thefts in 2022: 5,379 — 15th fewest of 50 states (0.5% of all U.S. car thefts)
Registered light-duty vehicles in state: 98.5 for every 100 people (3,153,300 total)
State population: 3,200,500 — 20th smallest of 50 states (1.0% of total U.S. population)
39. Pennsylvania
Motor-vehicle theft rate in 2022: 172.7 incidents per 100,000 people
Total, known motor-vehicle thefts in 2022: 22,407 — 15th most of 50 states (2.3% of all U.S. car thefts)
Registered light-duty vehicles in state: 78.7 for every 100 people (10,211,000 total)
State population: 12,972,000 — 5th largest of 50 states (3.9% of total U.S. population)
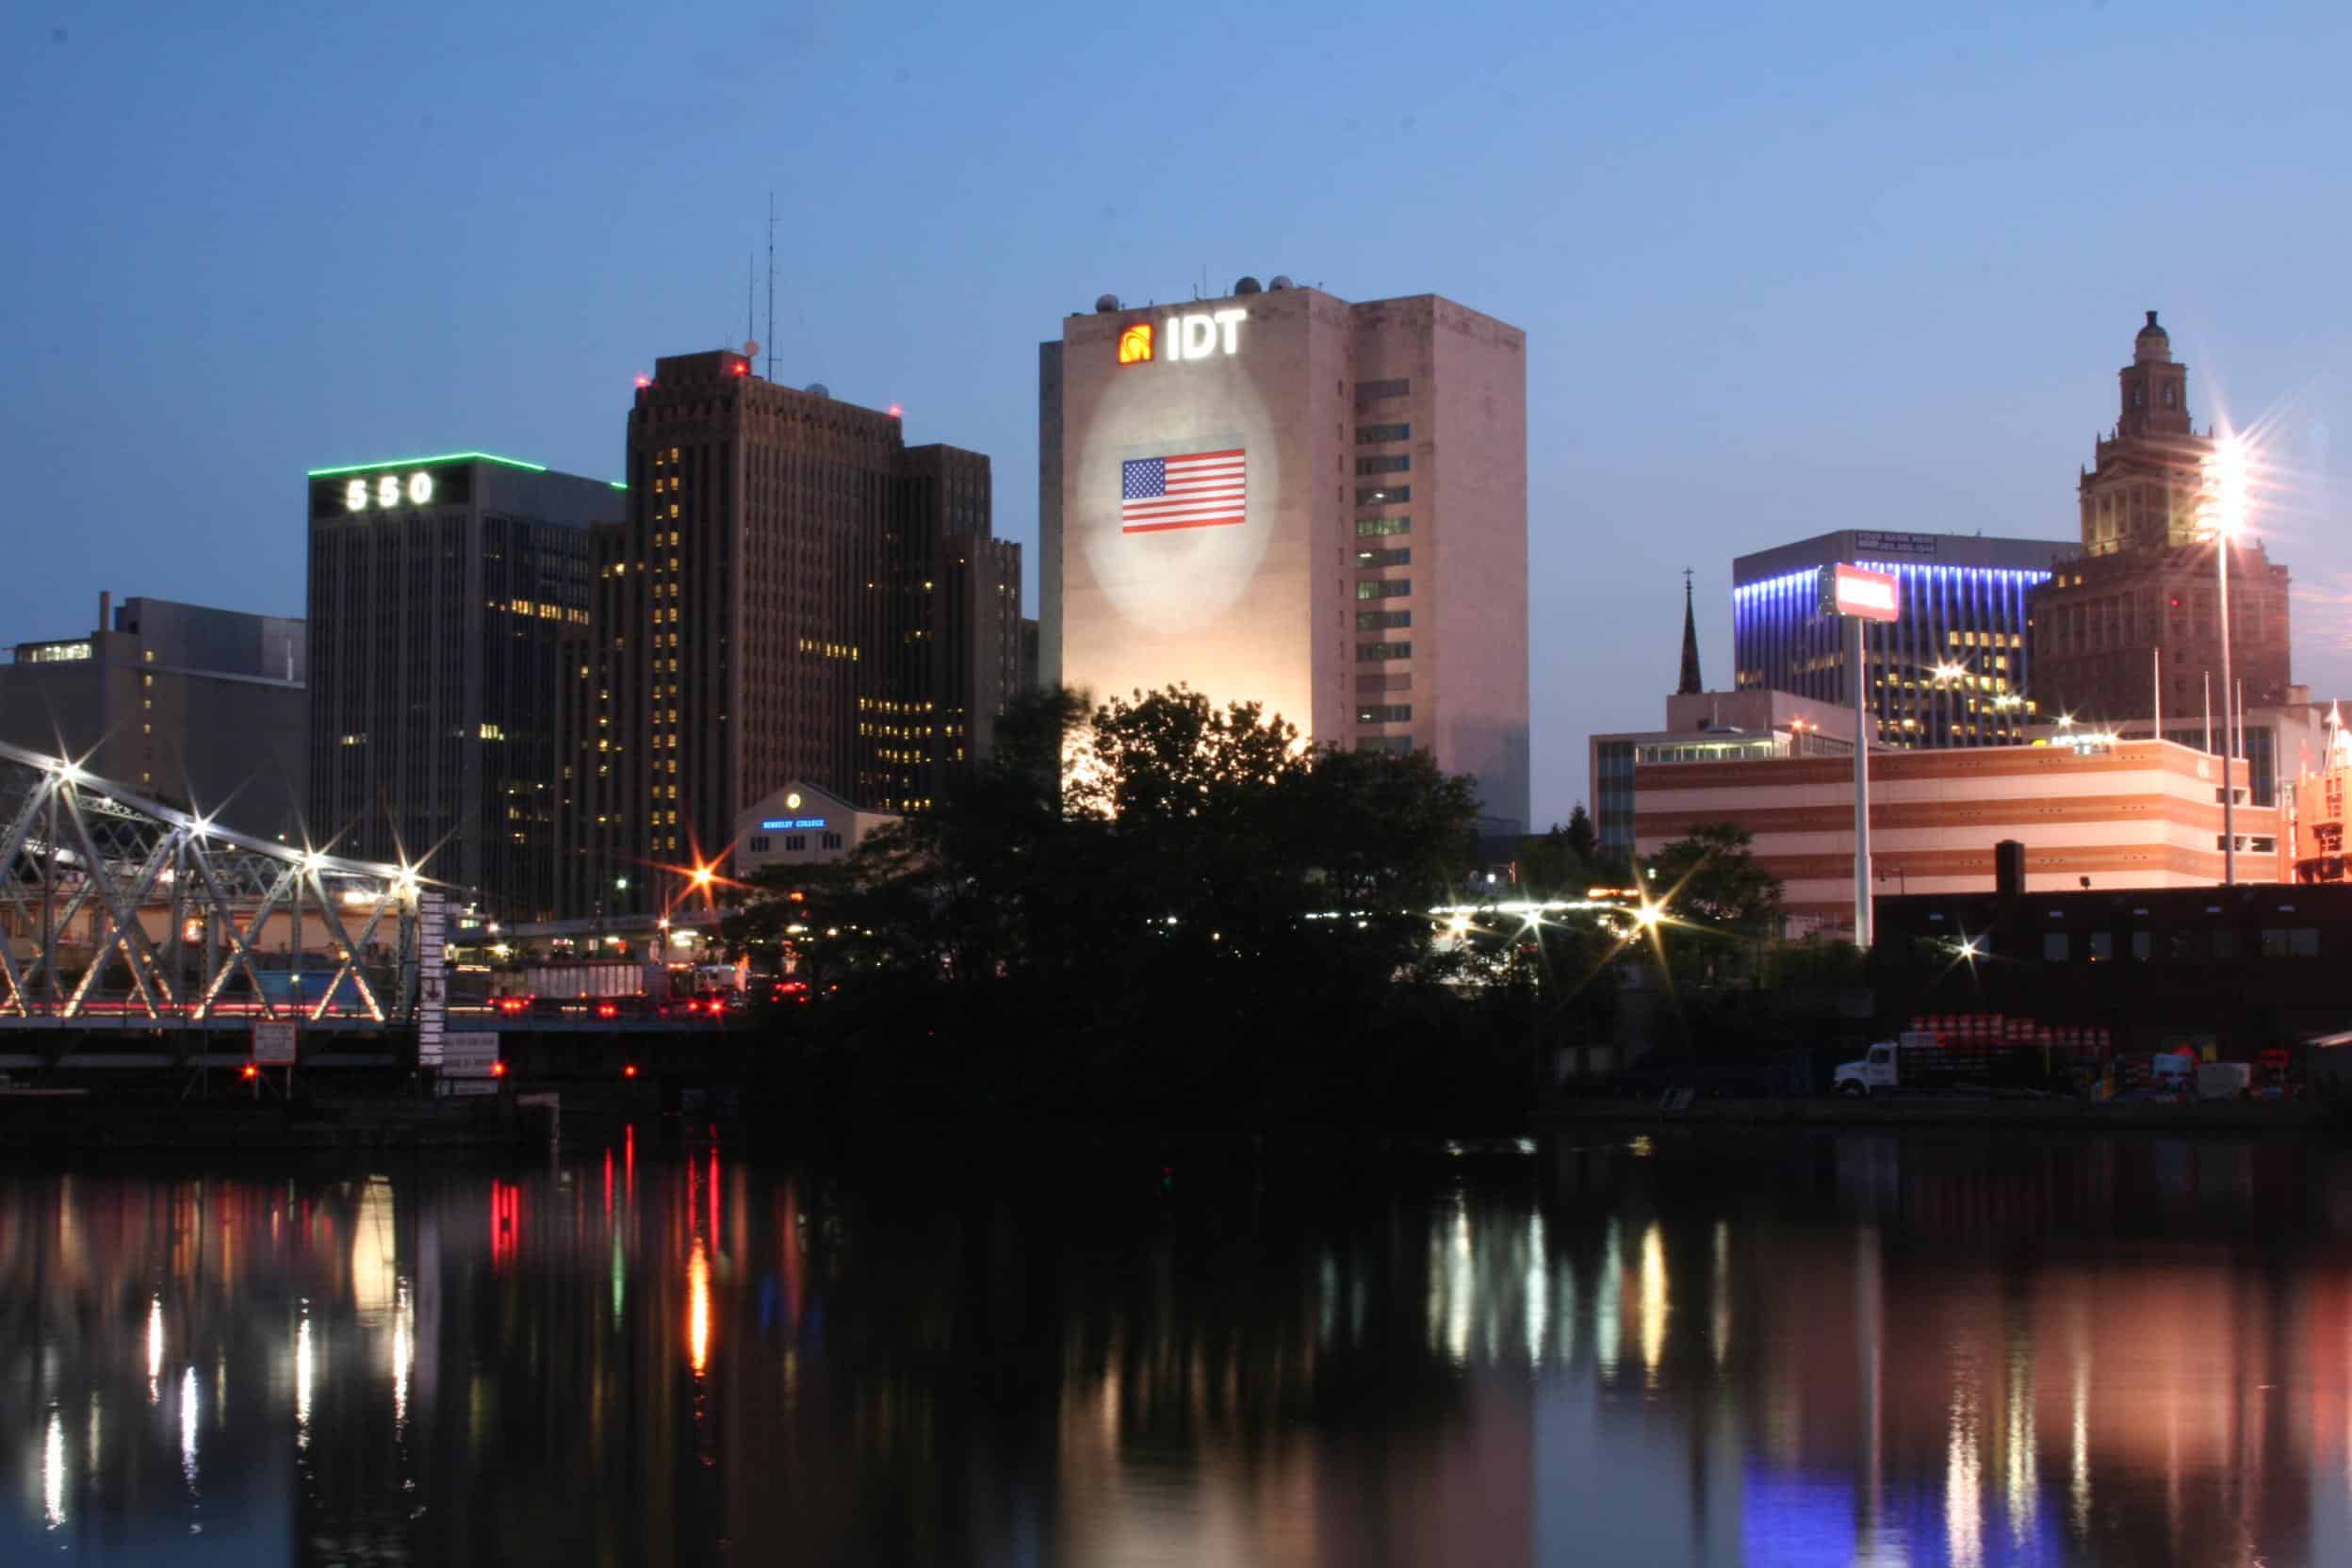
38. New Jersey
Motor-vehicle theft rate in 2022: 174.5 incidents per 100,000 people
Total, known motor-vehicle thefts in 2022: 16,165 — 18th most of 50 states (1.6% of all U.S. car thefts)
Registered light-duty vehicles in state: 79.1 for every 100 people (7,324,100 total)
State population: 9,261,700 — 11th largest of 50 states (2.8% of total U.S. population)
37. Hawaii
Motor-vehicle theft rate in 2022: 183.2 incidents per 100,000 people
Total, known motor-vehicle thefts in 2022: 2,639 — 13th fewest of 50 states (0.3% of all U.S. car thefts)
Registered light-duty vehicles in state: 75.0 for every 100 people (1,080,100 total)
State population: 1,440,200 — 11th smallest of 50 states (0.4% of total U.S. population)
36. Delaware
Motor-vehicle theft rate in 2022: 184.5 incidents per 100,000 people
Total, known motor-vehicle thefts in 2022: 1,879 — 9th fewest of 50 states (0.2% of all U.S. car thefts)
Registered light-duty vehicles in state: 89.8 for every 100 people (914,700 total)
State population: 1,018,400 — 6th smallest of 50 states (0.3% of total U.S. population)
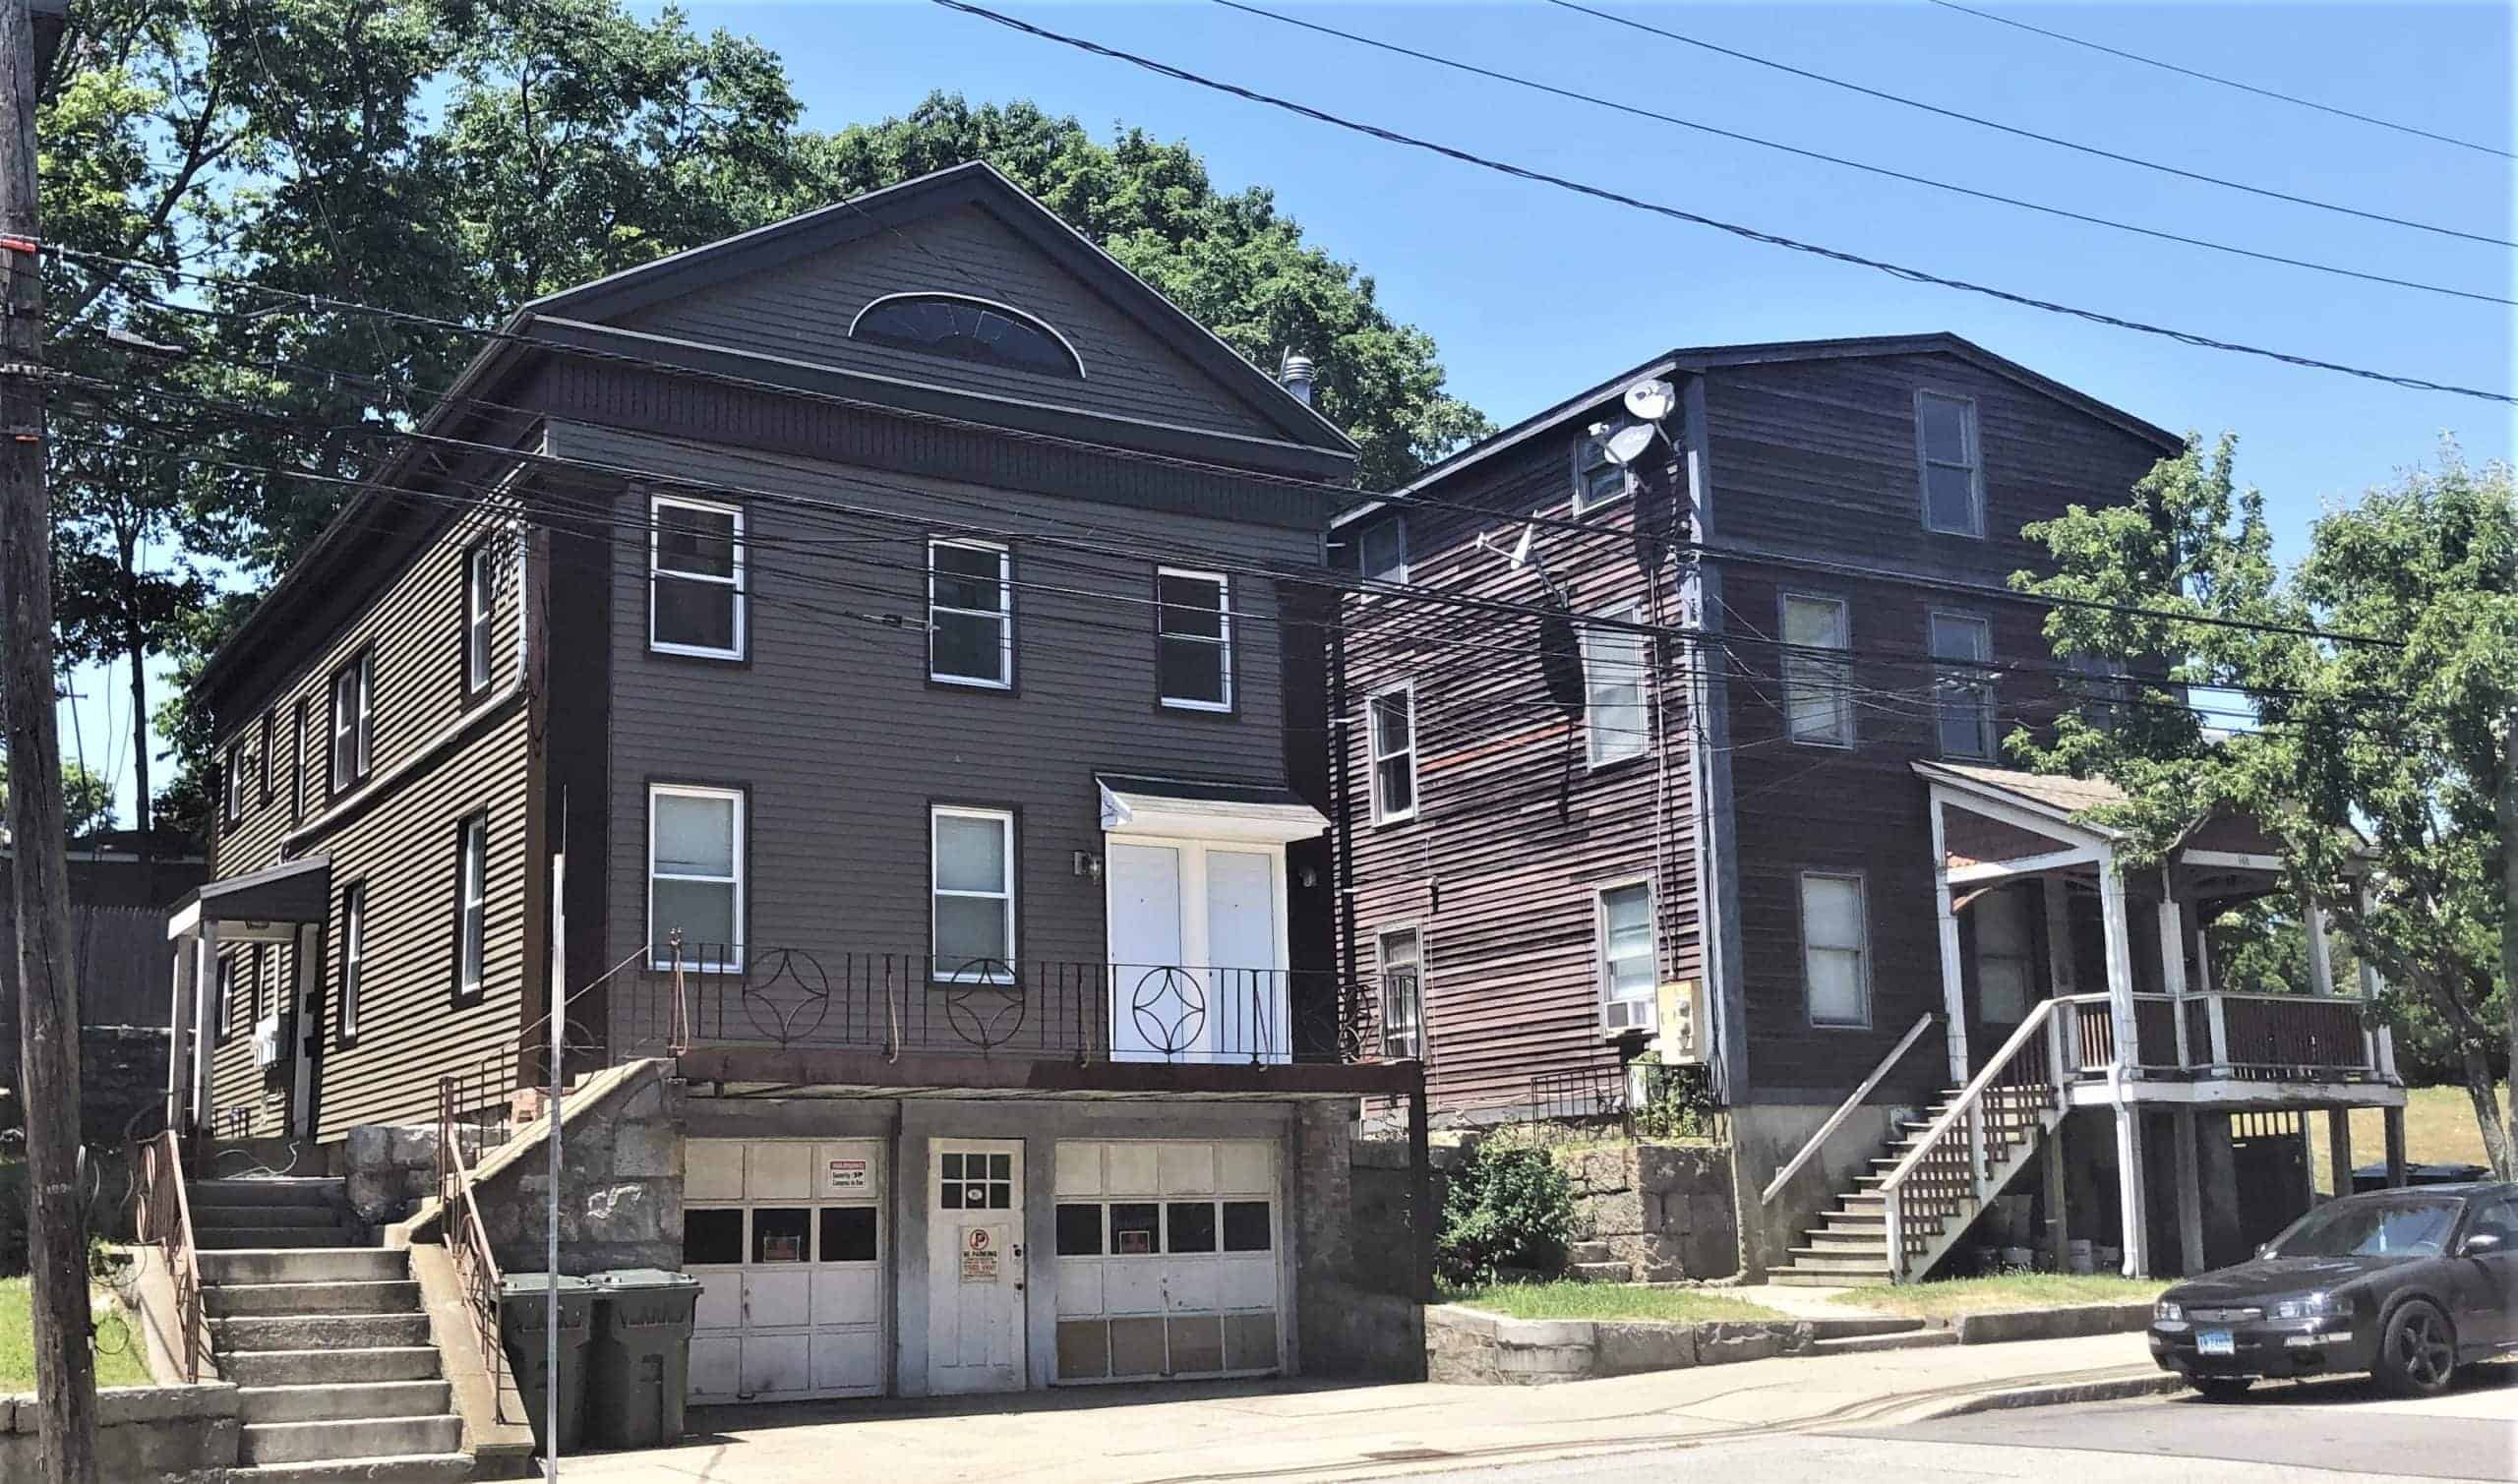
35. Connecticut
Motor-vehicle theft rate in 2022: 195.5 incidents per 100,000 people
Total, known motor-vehicle thefts in 2022: 7,091 — 19th fewest of 50 states (0.7% of all U.S. car thefts)
Registered light-duty vehicles in state: 81.2 for every 100 people (2,945,700 total)
State population: 3,626,200 — 22nd smallest of 50 states (1.1% of total U.S. population)
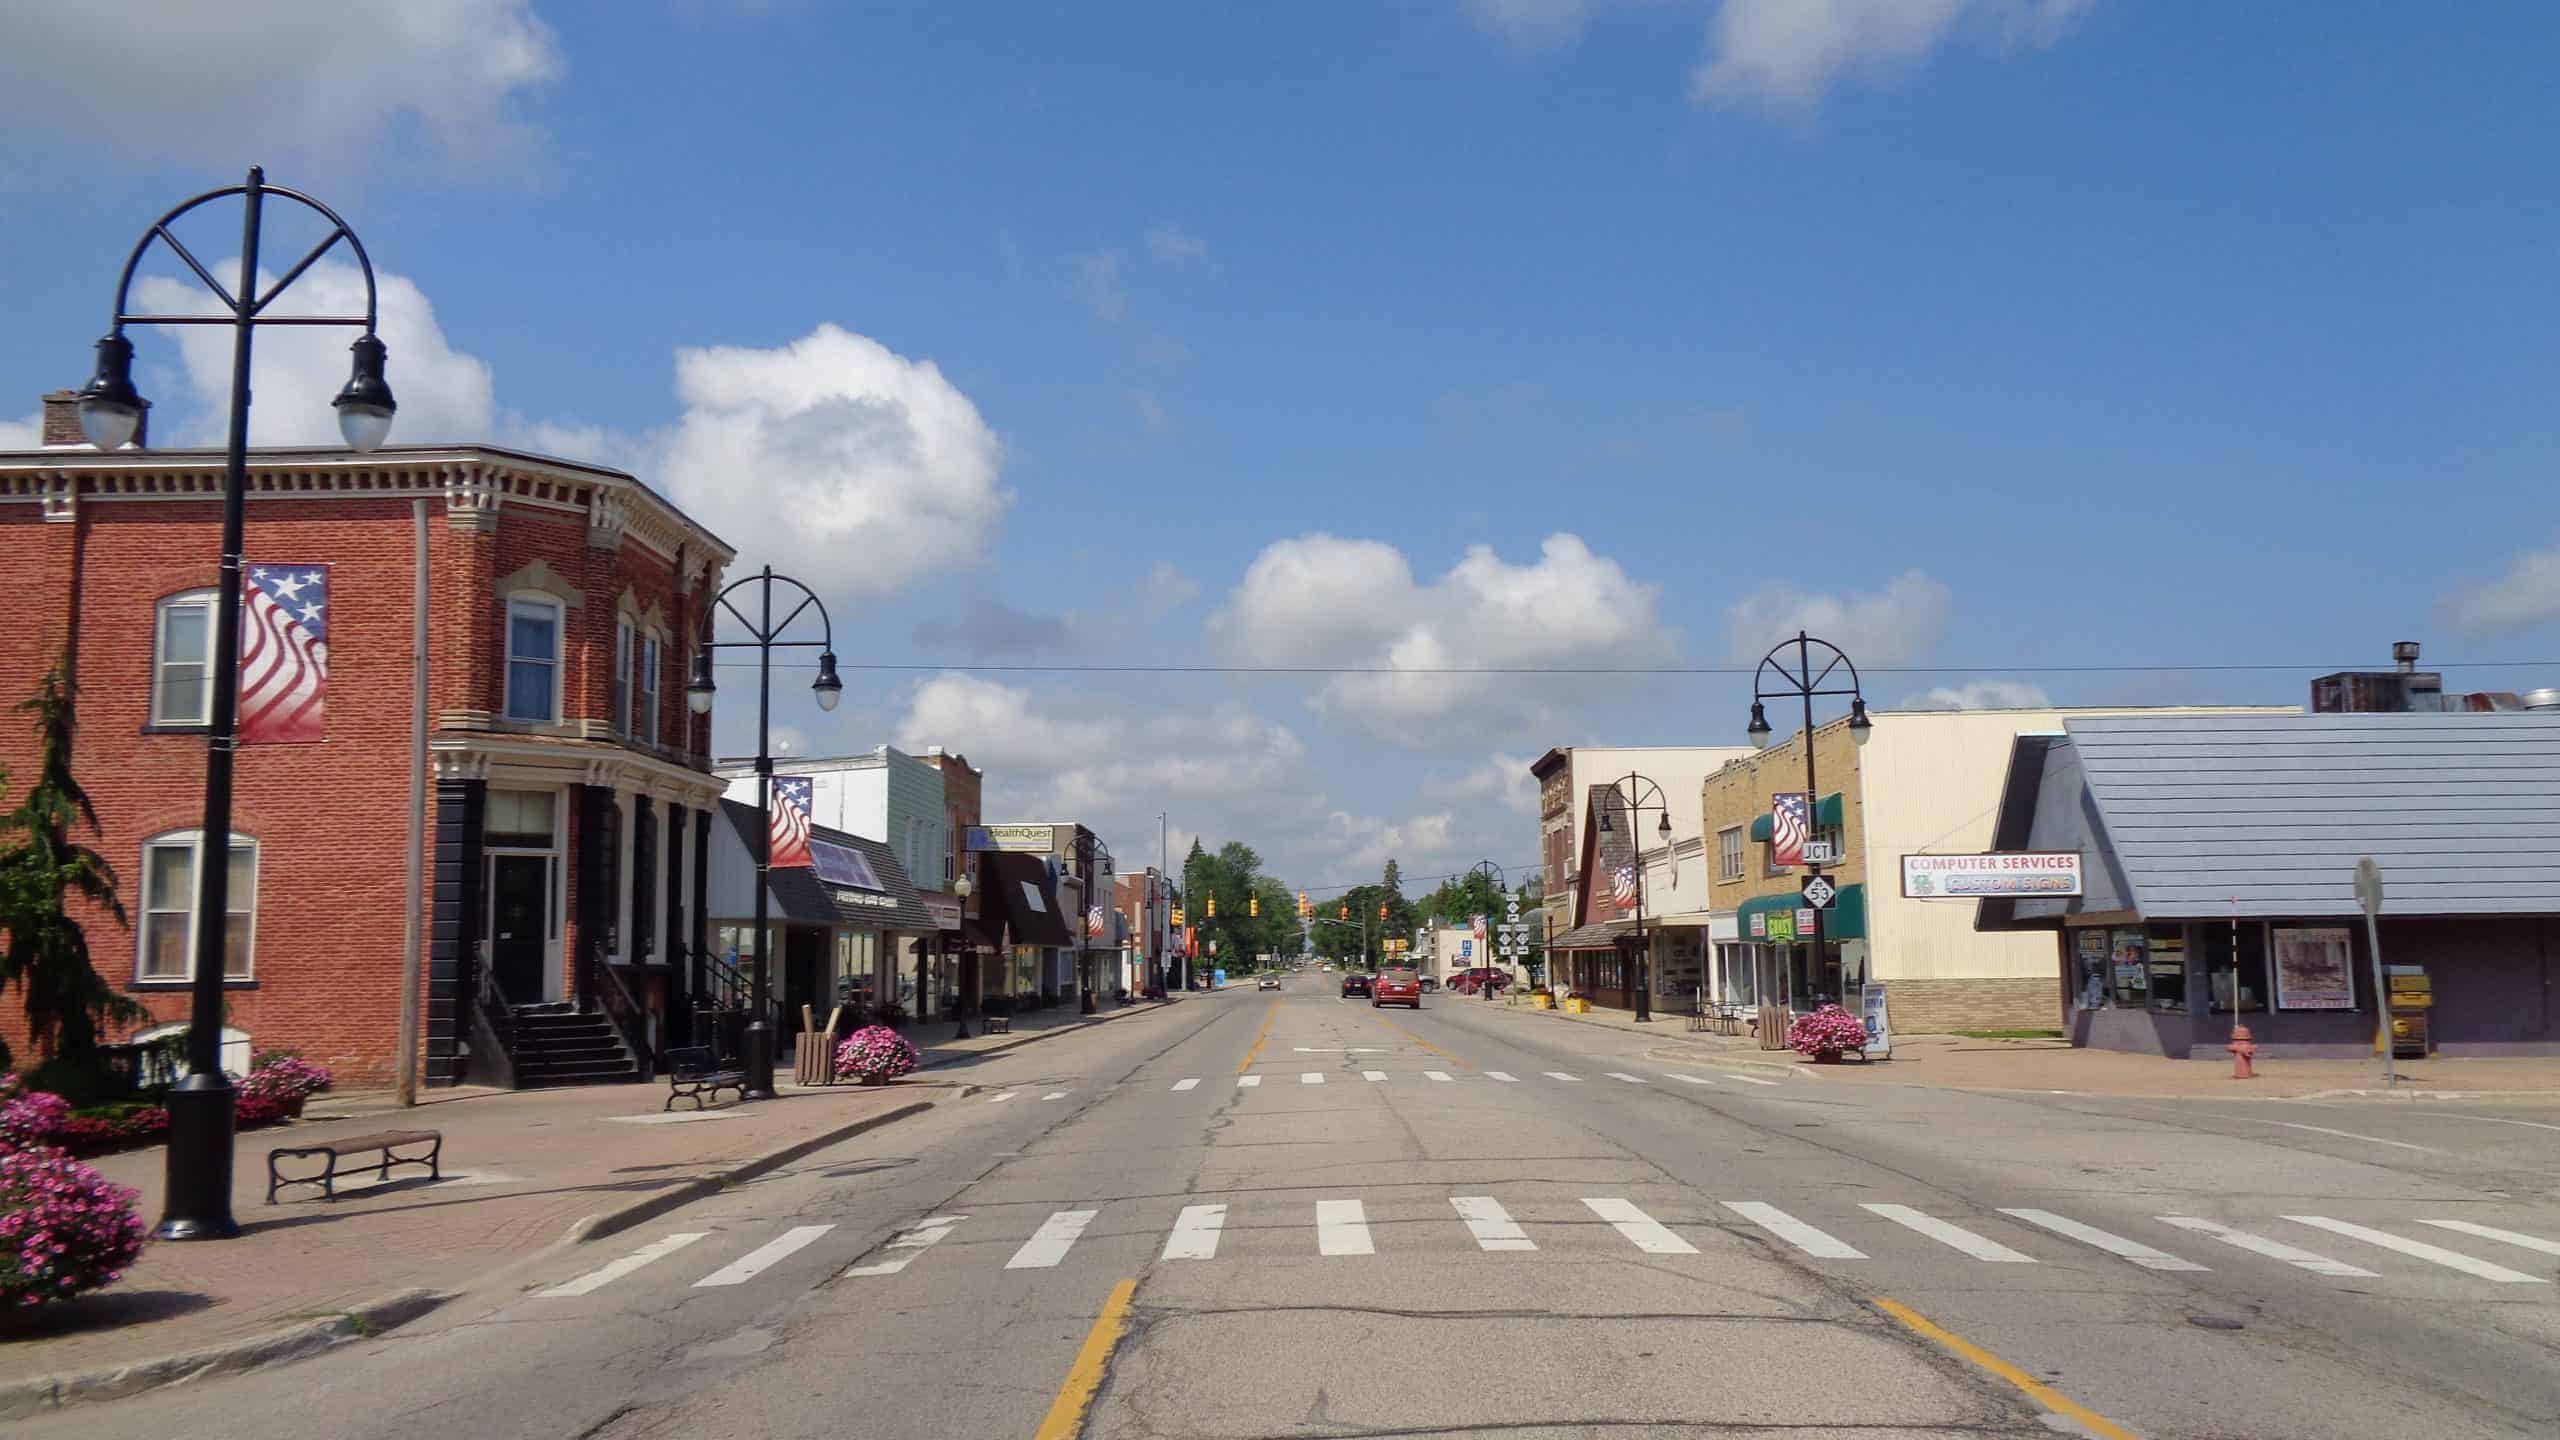
34. Wisconsin
Motor-vehicle theft rate in 2022: 198.7 incidents per 100,000 people
Total, known motor-vehicle thefts in 2022: 11,709 — 25th fewest of 50 states (1.2% of all U.S. car thefts)
Registered light-duty vehicles in state: 93.8 for every 100 people (5,529,000 total)
State population: 5,892,500 — 20th largest of 50 states (1.8% of total U.S. population)
33. Florida
Motor-vehicle theft rate in 2022: 206.9 incidents per 100,000 people
Total, known motor-vehicle thefts in 2022: 46,020 — 4th most of 50 states (4.6% of all U.S. car thefts)
Registered light-duty vehicles in state: 83.5 for every 100 people (18,583,200 total)
State population: 22,244,800 — 3rd largest of 50 states (6.7% of total U.S. population)
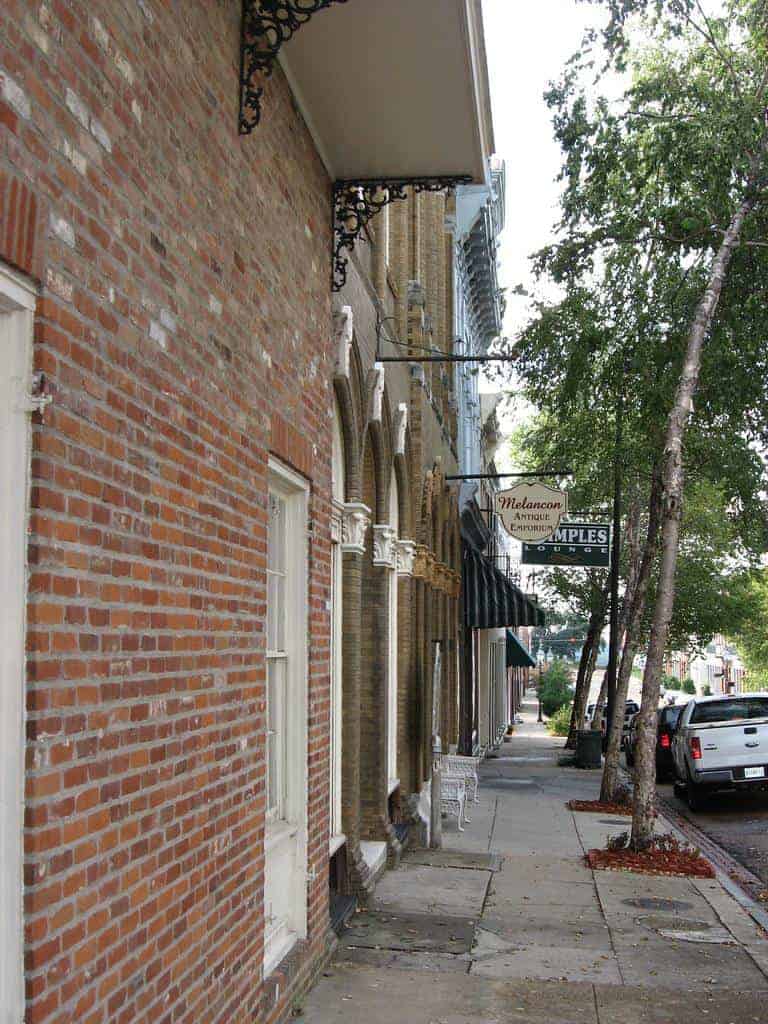
32. Mississippi
Motor-vehicle theft rate in 2022: 209.2 incidents per 100,000 people
Total, known motor-vehicle thefts in 2022: 6,150 — 16th fewest of 50 states (0.6% of all U.S. car thefts)
Registered light-duty vehicles in state: 92.6 for every 100 people (2,723,300 total)
State population: 2,940,100 — 17th smallest of 50 states (0.9% of total U.S. population)
31. Alabama
Motor-vehicle theft rate in 2022: 209.2 incidents per 100,000 people
Total, known motor-vehicle thefts in 2022: 10,616 — 23rd fewest of 50 states (1.1% of all U.S. car thefts)
Registered light-duty vehicles in state: 95.3 for every 100 people (4,835,900 total)
State population: 5,074,300 — 24th largest of 50 states (1.5% of total U.S. population)
30. Utah
Motor-vehicle theft rate in 2022: 209.5 incidents per 100,000 people
Total, known motor-vehicle thefts in 2022: 7,082 — 17th fewest of 50 states (0.7% of all U.S. car thefts)
Registered light-duty vehicles in state: 91.0 for every 100 people (3,076,200 total)
State population: 3,380,800 — 21st smallest of 50 states (1.0% of total U.S. population)
29. North Carolina
Motor-vehicle theft rate in 2022: 220.4 incidents per 100,000 people
Total, known motor-vehicle thefts in 2022: 23,576 — 13th most of 50 states (2.4% of all U.S. car thefts)
Registered light-duty vehicles in state: 84.9 for every 100 people (9,085,500 total)
State population: 10,699,000 — 9th largest of 50 states (3.2% of total U.S. population)
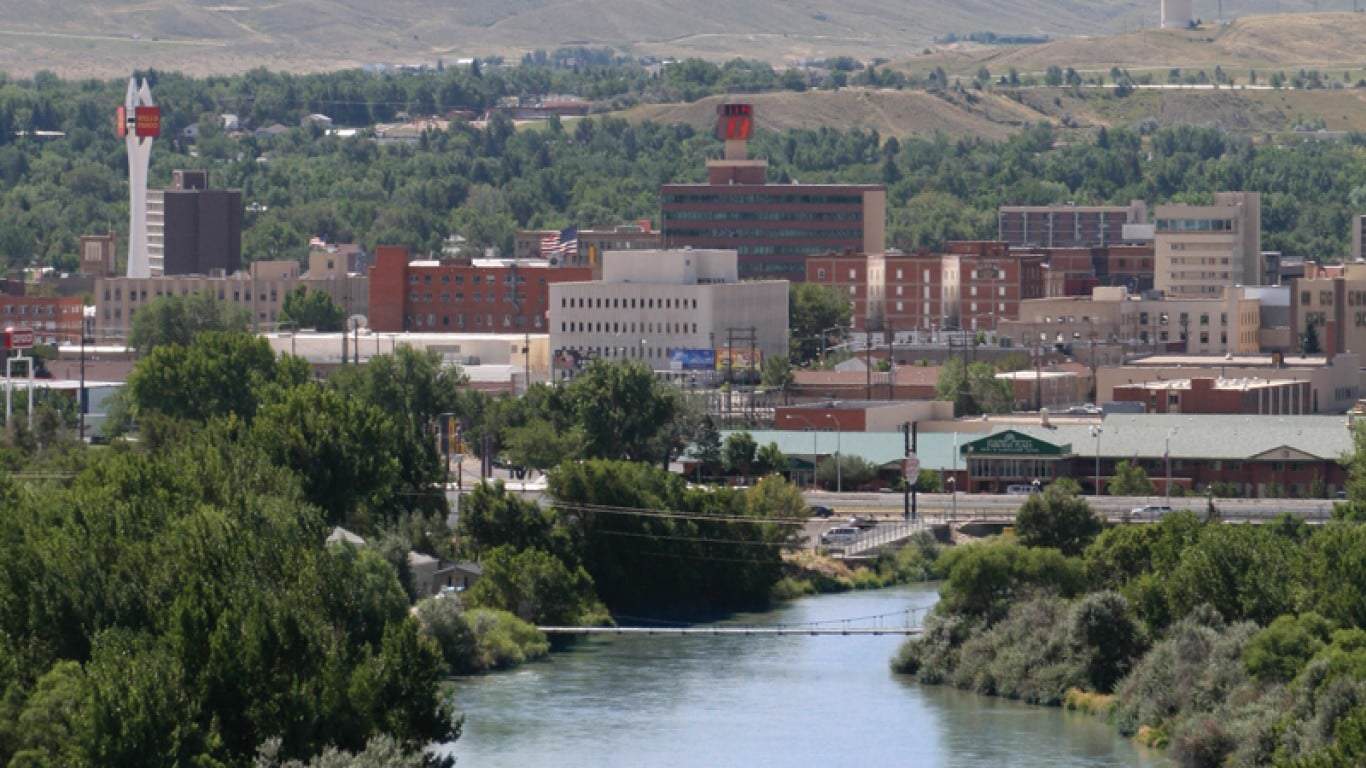
28. Montana
Motor-vehicle theft rate in 2022: 223.7 incidents per 100,000 people
Total, known motor-vehicle thefts in 2022: 2,512 — 12th fewest of 50 states (0.3% of all U.S. car thefts)
Registered light-duty vehicles in state: 91.0 for every 100 people (1,021,700 total)
State population: 1,122,900 — 8th smallest of 50 states (0.3% of total U.S. population)
27. North Dakota
Motor-vehicle theft rate in 2022: 224.6 incidents per 100,000 people
Total, known motor-vehicle thefts in 2022: 1,750 — 5th fewest of 50 states (0.2% of all U.S. car thefts)
Registered light-duty vehicles in state: 102.3 for every 100 people (797,400 total)
State population: 779,300 — 4th smallest of 50 states (0.2% of total U.S. population)
26. Indiana
Motor-vehicle theft rate in 2022: 226.0 incidents per 100,000 people
Total, known motor-vehicle thefts in 2022: 15,440 — 20th most of 50 states (1.6% of all U.S. car thefts)
Registered light-duty vehicles in state: 90.3 for every 100 people (6,172,100 total)
State population: 6,833,000 — 17th largest of 50 states (2.1% of total U.S. population)
25. Kentucky
Motor-vehicle theft rate in 2022: 226.4 incidents per 100,000 people
Total, known motor-vehicle thefts in 2022: 10,217 — 22nd fewest of 50 states (1.0% of all U.S. car thefts)
Registered light-duty vehicles in state: 89.5 for every 100 people (4,039,700 total)
State population: 4,512,300 — 25th smallest of 50 states (1.4% of total U.S. population)
24. Georgia
Motor-vehicle theft rate in 2022: 243.9 incidents per 100,000 people
Total, known motor-vehicle thefts in 2022: 26,612 — 10th most of 50 states (2.7% of all U.S. car thefts)
Registered light-duty vehicles in state: 88.4 for every 100 people (9,642,400 total)
State population: 10,912,900 — 8th largest of 50 states (3.3% of total U.S. population)
23. Alaska
Motor-vehicle theft rate in 2022: 245.6 incidents per 100,000 people
Total, known motor-vehicle thefts in 2022: 1,802 — 8th fewest of 50 states (0.2% of all U.S. car thefts)
Registered light-duty vehicles in state: 76.3 for every 100 people (559,800 total)
State population: 733,600 — 3rd smallest of 50 states (0.2% of total U.S. population)
22. South Dakota
Motor-vehicle theft rate in 2022: 248.3 incidents per 100,000 people
Total, known motor-vehicle thefts in 2022: 2,259 — 11th fewest of 50 states (0.2% of all U.S. car thefts)
Registered light-duty vehicles in state: 100.9 for every 100 people (918,000 total)
State population: 909,800 — 5th smallest of 50 states (0.3% of total U.S. population)
21. Michigan
Motor-vehicle theft rate in 2022: 256.7 incidents per 100,000 people
Total, known motor-vehicle thefts in 2022: 25,753 — 11th most of 50 states (2.6% of all U.S. car thefts)
Registered light-duty vehicles in state: 85.0 for every 100 people (8,525,400 total)
State population: 10,034,100 — 10th largest of 50 states (3.0% of total U.S. population)
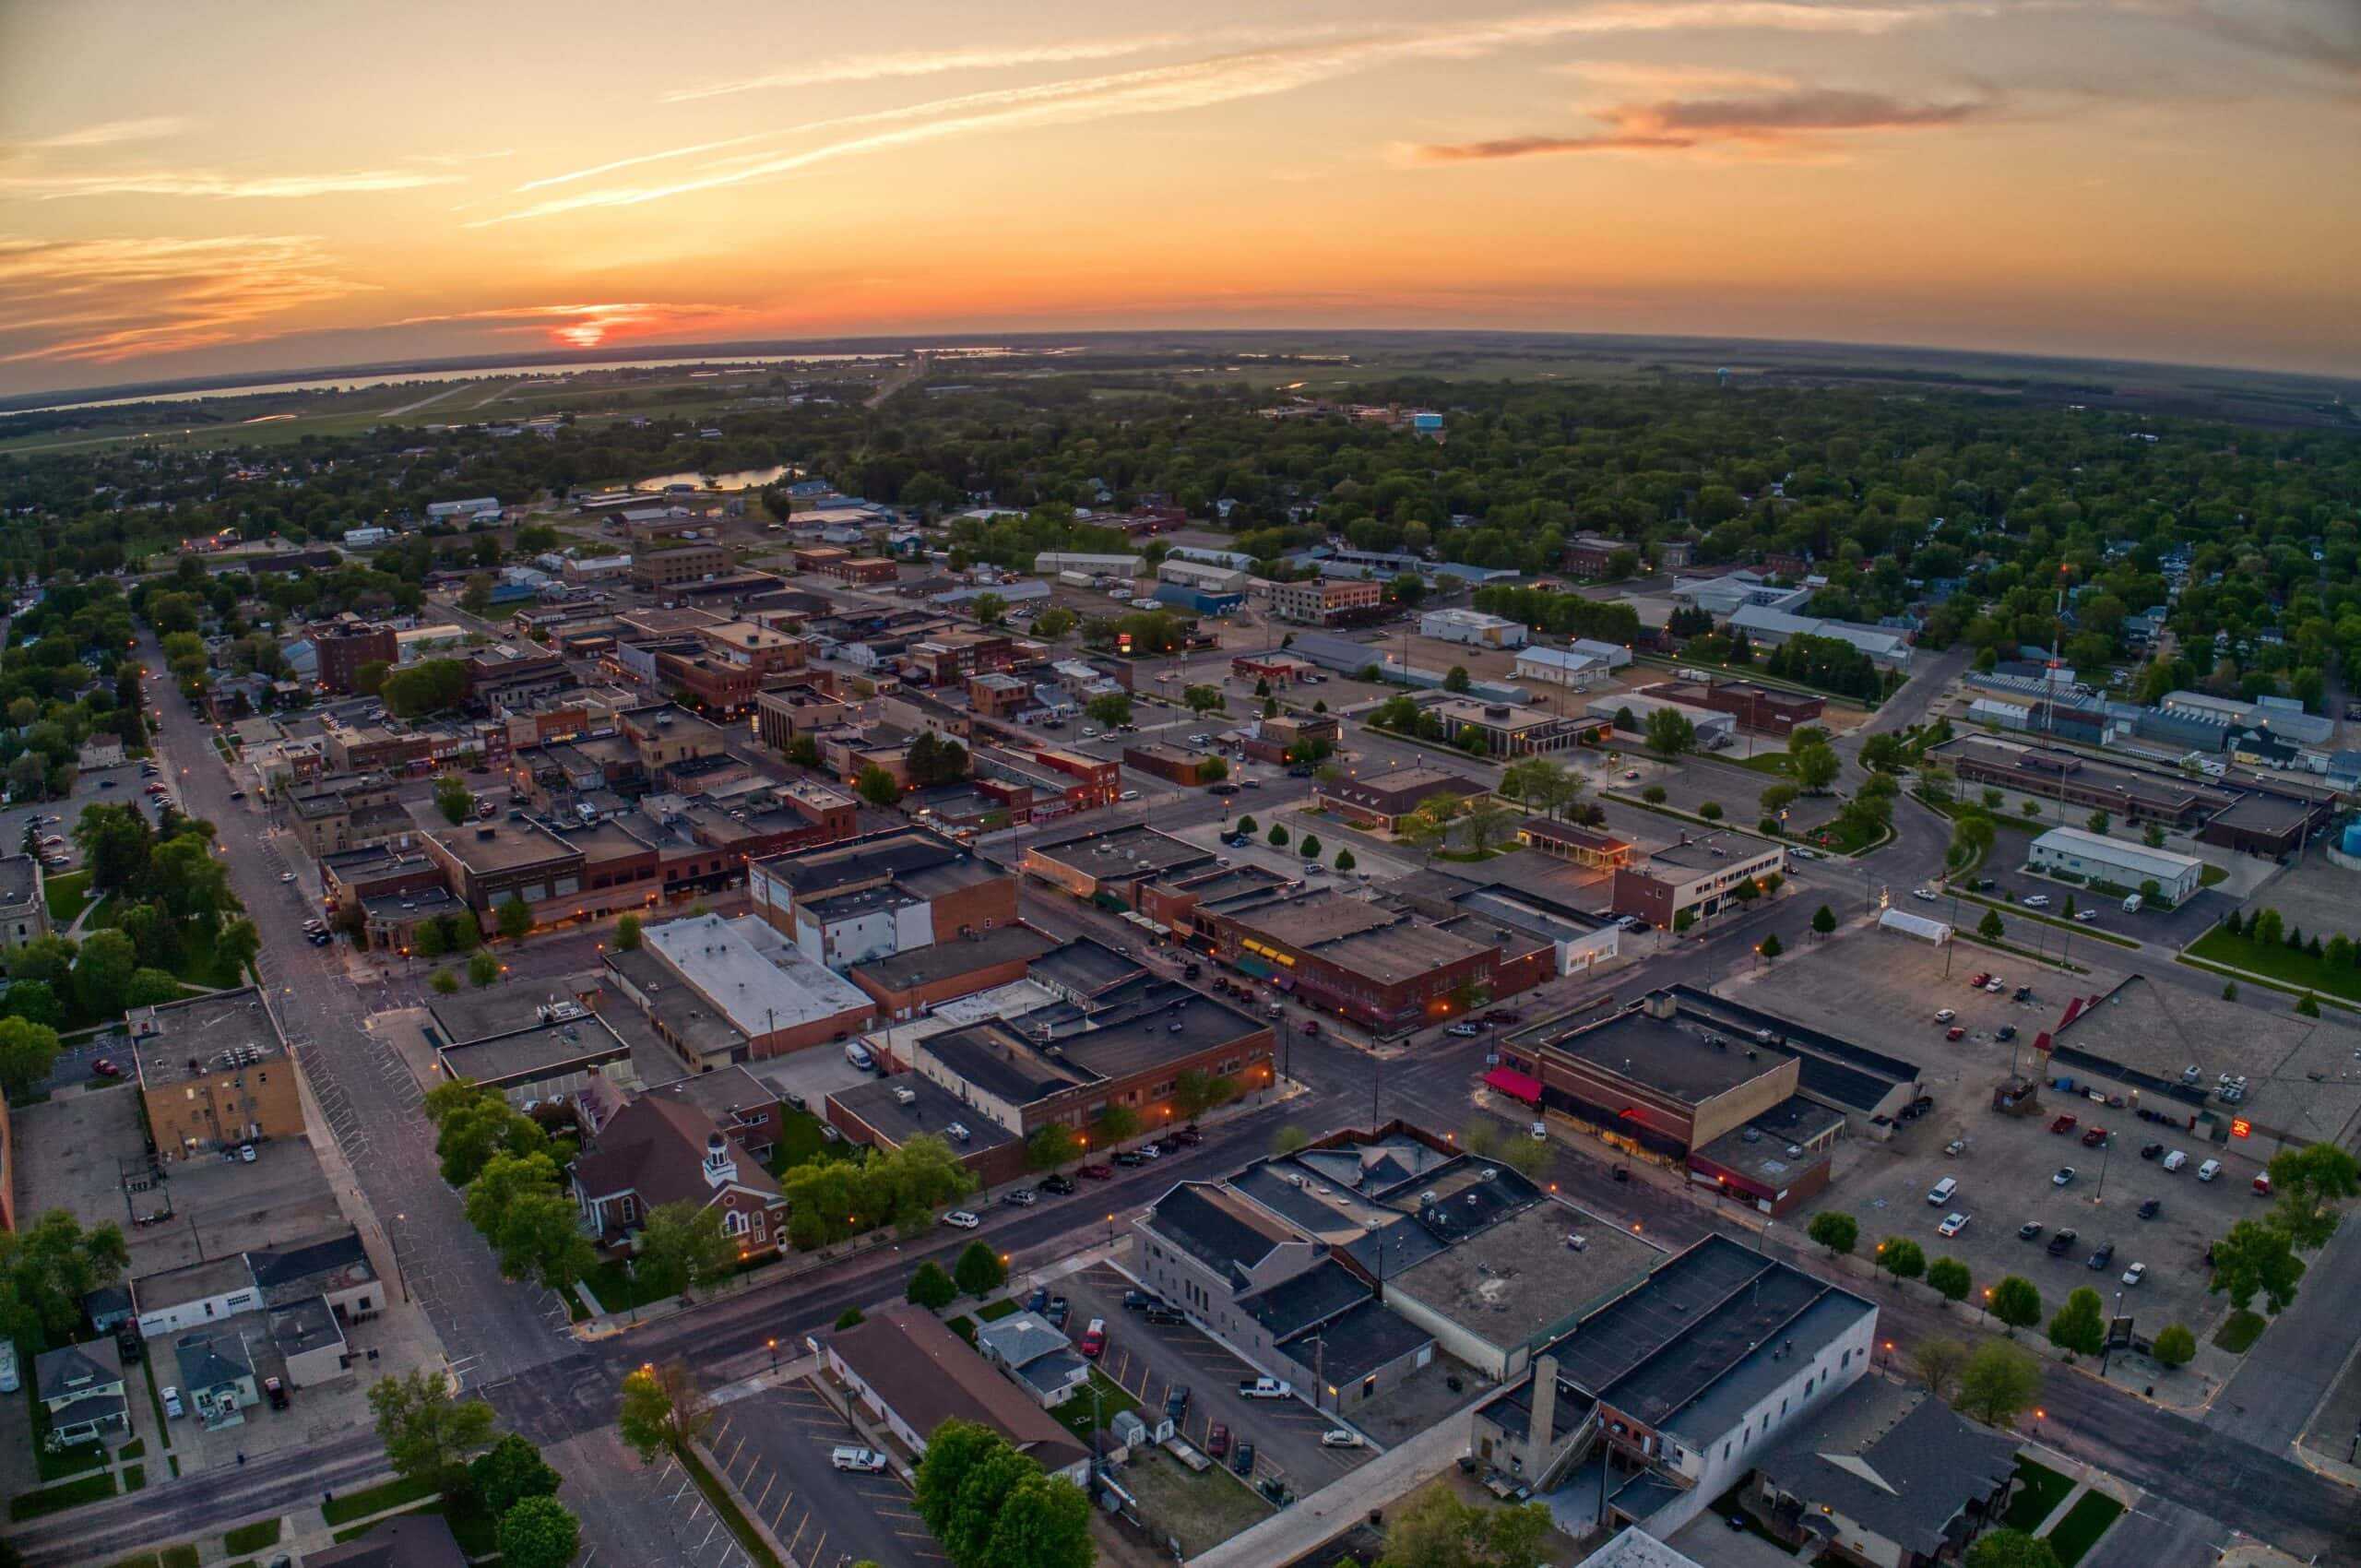
20. Nebraska
Motor-vehicle theft rate in 2022: 257.0 incidents per 100,000 people
Total, known motor-vehicle thefts in 2022: 5,058 — 14th fewest of 50 states (0.5% of all U.S. car thefts)
Registered light-duty vehicles in state: 100.2 for every 100 people (1,971,200 total)
State population: 1,967,900 — 14th smallest of 50 states (0.6% of total U.S. population)
19. Ohio
Motor-vehicle theft rate in 2022: 258.3 incidents per 100,000 people
Total, known motor-vehicle thefts in 2022: 30,361 — 7th most of 50 states (3.1% of all U.S. car thefts)
Registered light-duty vehicles in state: 87.8 for every 100 people (10,317,300 total)
State population: 11,756,100 — 7th largest of 50 states (3.5% of total U.S. population)
18. Maryland
Motor-vehicle theft rate in 2022: 260.9 incidents per 100,000 people
Total, known motor-vehicle thefts in 2022: 16,086 — 19th most of 50 states (1.6% of all U.S. car thefts)
Registered light-duty vehicles in state: 82.1 for every 100 people (5,060,000 total)
State population: 6,164,700 — 19th largest of 50 states (1.9% of total U.S. population)
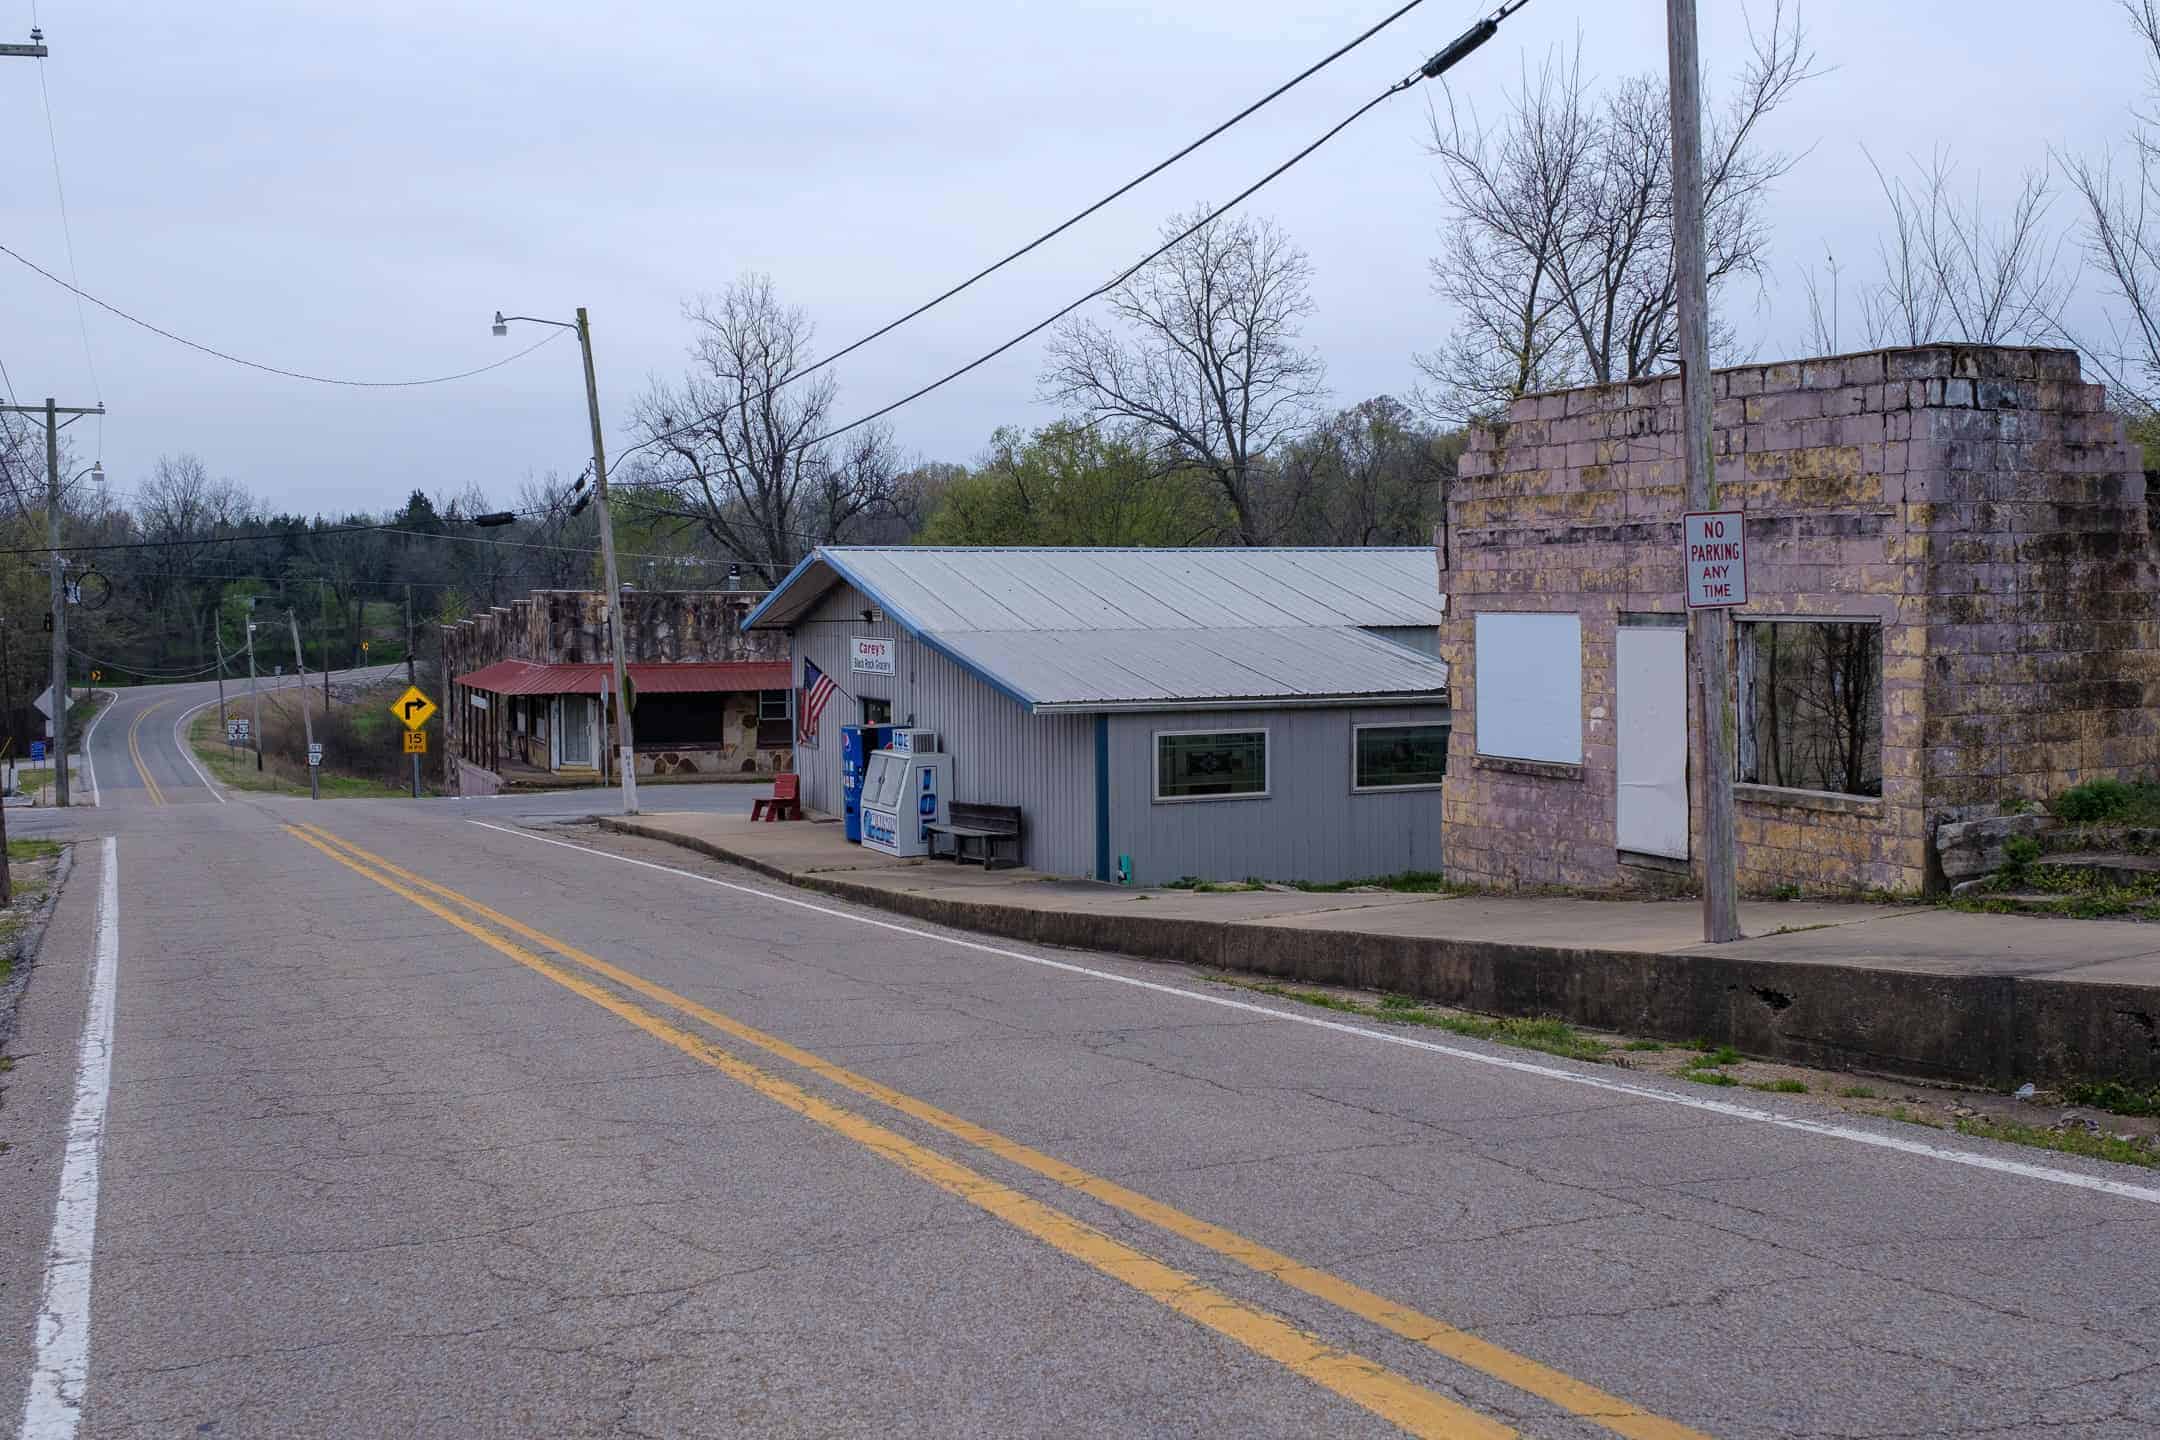
17. Arkansas
Motor-vehicle theft rate in 2022: 269.8 incidents per 100,000 people
Total, known motor-vehicle thefts in 2022: 8,216 — 20th fewest of 50 states (0.8% of all U.S. car thefts)
Registered light-duty vehicles in state: 88.9 for every 100 people (2,708,300 total)
State population: 3,045,600 — 18th smallest of 50 states (0.9% of total U.S. population)
16. South Carolina
Motor-vehicle theft rate in 2022: 290.5 incidents per 100,000 people
Total, known motor-vehicle thefts in 2022: 15,345 — 21st most of 50 states (1.5% of all U.S. car thefts)
Registered light-duty vehicles in state: 95.5 for every 100 people (5,042,400 total)
State population: 5,282,600 — 23rd largest of 50 states (1.6% of total U.S. population)
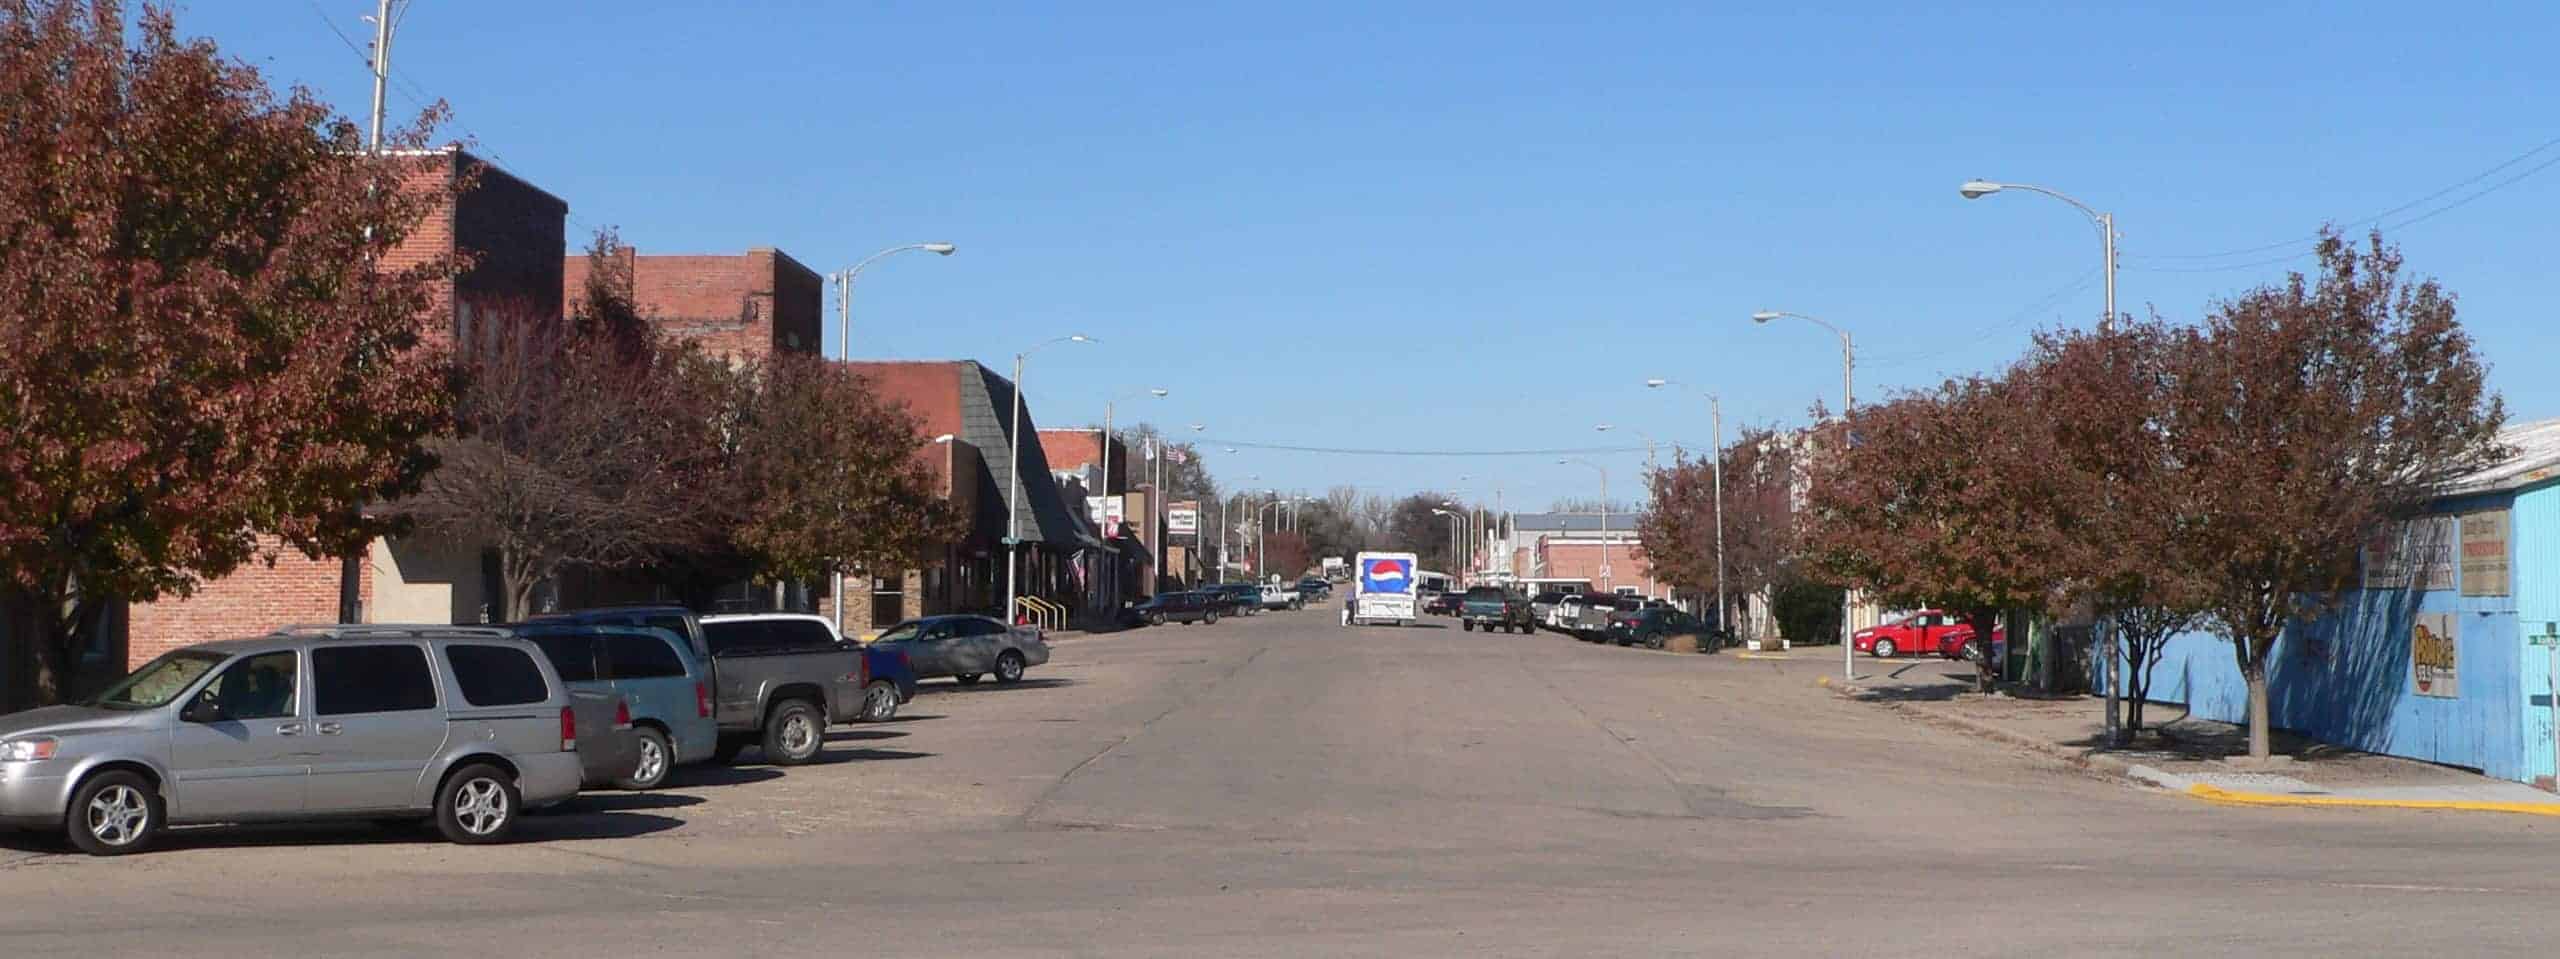
15. Kansas
Motor-vehicle theft rate in 2022: 292.4 incidents per 100,000 people
Total, known motor-vehicle thefts in 2022: 8,588 — 21st fewest of 50 states (0.9% of all U.S. car thefts)
Registered light-duty vehicles in state: 89.2 for every 100 people (2,621,100 total)
State population: 2,937,200 — 16th smallest of 50 states (0.9% of total U.S. population)
14. Arizona
Motor-vehicle theft rate in 2022: 294.8 incidents per 100,000 people
Total, known motor-vehicle thefts in 2022: 21,694 — 16th most of 50 states (2.2% of all U.S. car thefts)
Registered light-duty vehicles in state: 88.7 for every 100 people (6,529,000 total)
State population: 7,359,200 — 14th largest of 50 states (2.2% of total U.S. population)
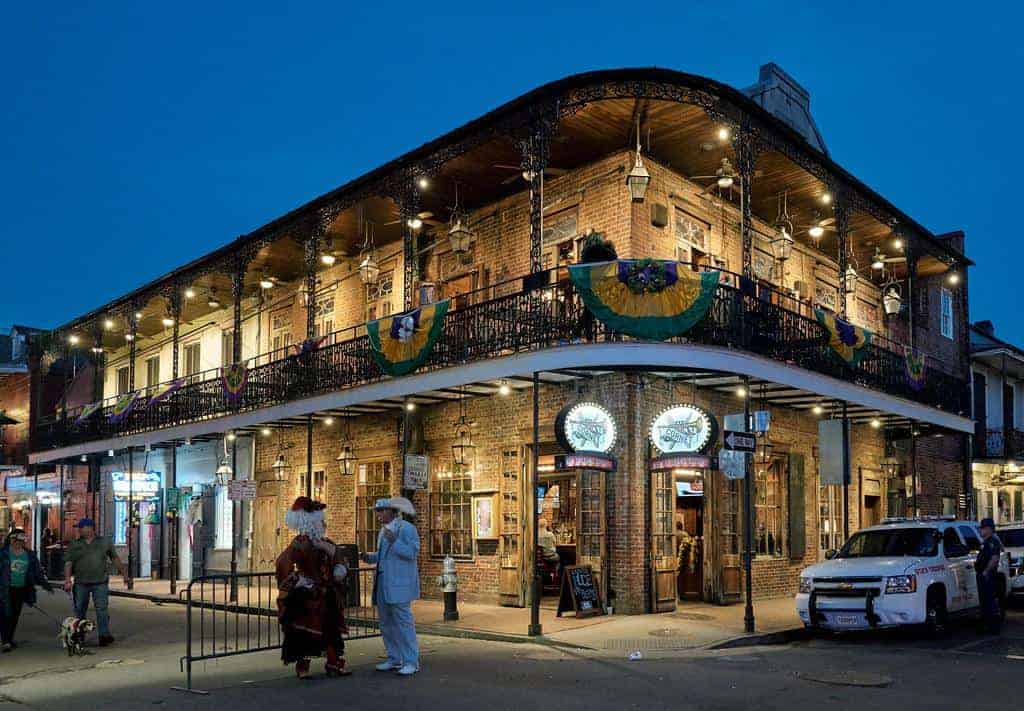
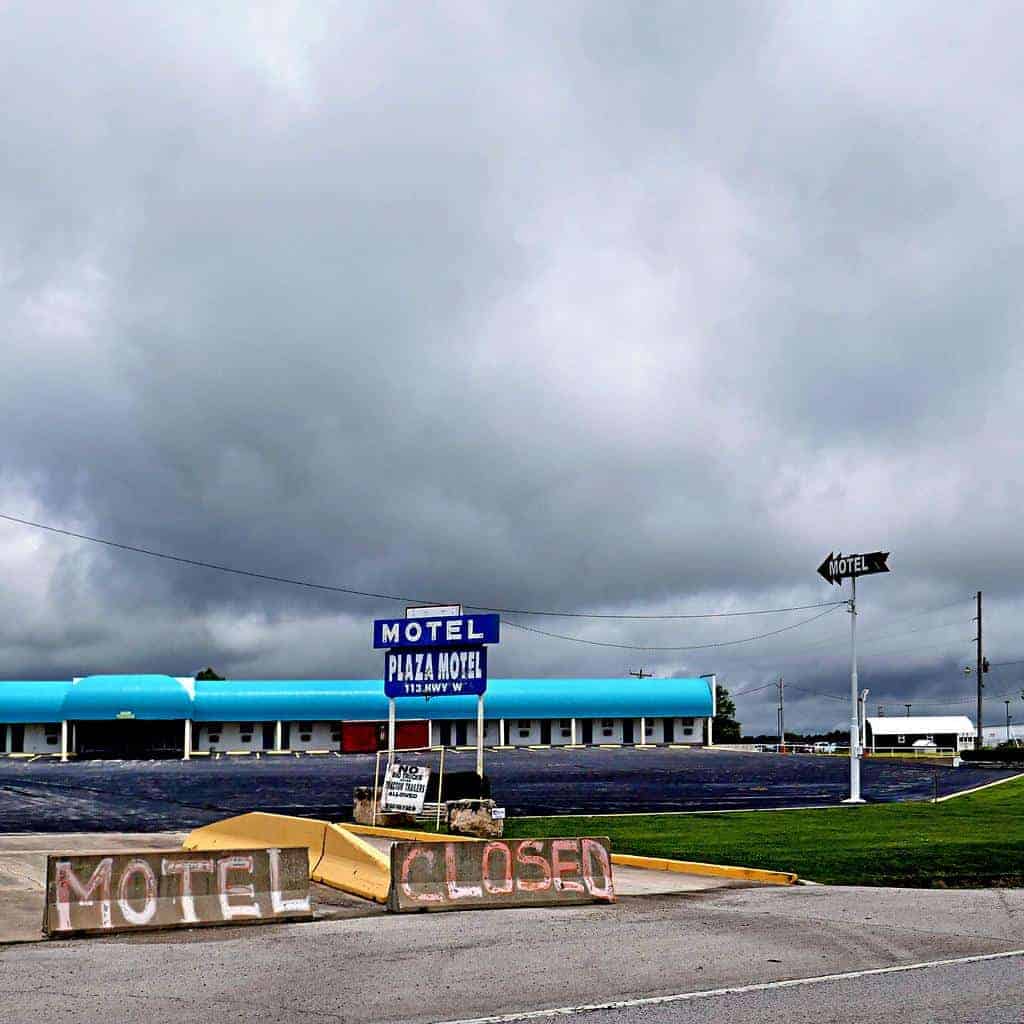
13. Louisiana
Motor-vehicle theft rate in 2022: 297.1 incidents per 100,000 people
Total, known motor-vehicle thefts in 2022: 13,638 — 24th most of 50 states (1.4% of all U.S. car thefts)
Registered light-duty vehicles in state: 82.2 for every 100 people (3,774,200 total)
State population: 4,590,200 — 25th largest of 50 states (1.4% of total U.S. population)
12. Oklahoma
Motor-vehicle theft rate in 2022: 298.7 incidents per 100,000 people
Total, known motor-vehicle thefts in 2022: 12,007 — 25th most of 50 states (1.2% of all U.S. car thefts)
Registered light-duty vehicles in state: 106.7 for every 100 people (4,287,900 total)
State population: 4,019,800 — 23rd smallest of 50 states (1.2% of total U.S. population)
11. Illinois
Motor-vehicle theft rate in 2022: 307.6 incidents per 100,000 people
Total, known motor-vehicle thefts in 2022: 38,699 — 6th most of 50 states (3.9% of all U.S. car thefts)
Registered light-duty vehicles in state: 79.8 for every 100 people (10,043,200 total)
State population: 12,582,000 — 6th largest of 50 states (3.8% of total U.S. population)
10. Minnesota
Motor-vehicle theft rate in 2022: 311.9 incidents per 100,000 people
Total, known motor-vehicle thefts in 2022: 17,832 — 17th most of 50 states (1.8% of all U.S. car thefts)
Registered light-duty vehicles in state: 89.5 for every 100 people (5,118,500 total)
State population: 5,717,200 — 22nd largest of 50 states (1.7% of total U.S. population)
9. Tennessee
Motor-vehicle theft rate in 2022: 337.9 incidents per 100,000 people
Total, known motor-vehicle thefts in 2022: 23,830 — 12th most of 50 states (2.4% of all U.S. car thefts)
Registered light-duty vehicles in state: 92.7 for every 100 people (6,538,800 total)
State population: 7,051,300 — 15th largest of 50 states (2.1% of total U.S. population)
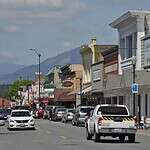
8. Texas
Motor-vehicle theft rate in 2022: 350.1 incidents per 100,000 people
Total, known motor-vehicle thefts in 2022: 105,133 — 2nd most of 50 states (10.6% of all U.S. car thefts)
Registered light-duty vehicles in state: 85.9 for every 100 people (25,796,600 total)
State population: 30,029,600 — 2nd largest of 50 states (9.0% of total U.S. population)
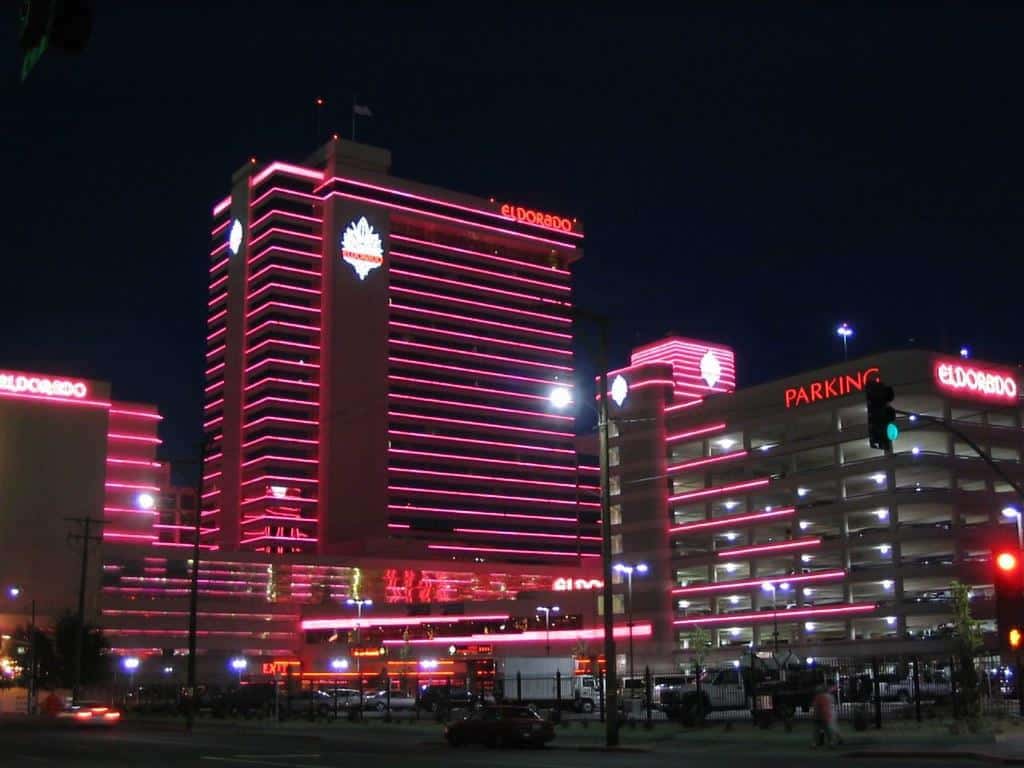
7. Nevada
Motor-vehicle theft rate in 2022: 480.8 incidents per 100,000 people
Total, known motor-vehicle thefts in 2022: 15,279 — 22nd most of 50 states (1.5% of all U.S. car thefts)
Registered light-duty vehicles in state: 80.4 for every 100 people (2,556,100 total)
State population: 3,177,800 — 19th smallest of 50 states (1.0% of total U.S. population)
6. Missouri
Motor-vehicle theft rate in 2022: 482.6 incidents per 100,000 people
Total, known motor-vehicle thefts in 2022: 29,815 — 8th most of 50 states (3.0% of all U.S. car thefts)
Registered light-duty vehicles in state: 91.1 for every 100 people (5,626,000 total)
State population: 6,178,000 — 18th largest of 50 states (1.9% of total U.S. population)
5. California
Motor-vehicle theft rate in 2022: 520.2 incidents per 100,000 people
Total, known motor-vehicle thefts in 2022: 203,018 — the most of 50 states (20.4% of all U.S. car thefts)
Registered light-duty vehicles in state: 94.4 for every 100 people (36,850,300 total)
State population: 39,029,300 — the largest of 50 states (11.7% of total U.S. population)
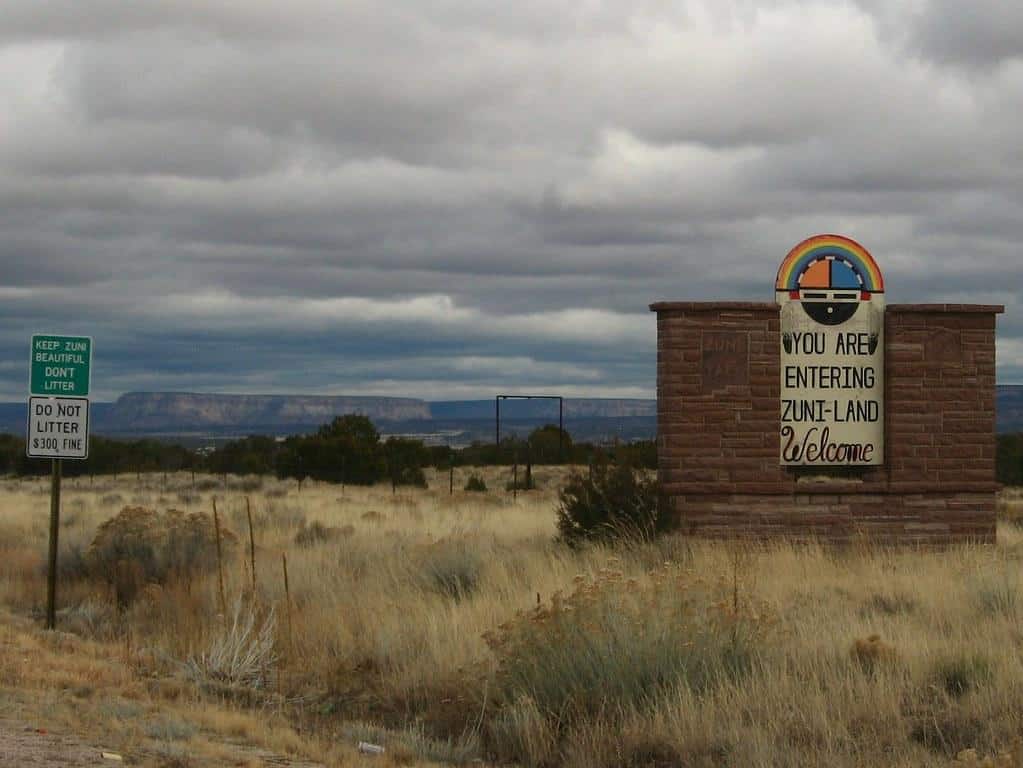
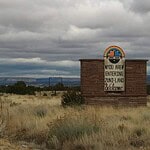
4. New Mexico
Motor-vehicle theft rate in 2022: 540.6 incidents per 100,000 people
Total, known motor-vehicle thefts in 2022: 11,424 — 24th fewest of 50 states (1.1% of all U.S. car thefts)
Registered light-duty vehicles in state: 92.4 for every 100 people (1,952,400 total)
State population: 2,113,300 — 15th smallest of 50 states (0.6% of total U.S. population)
3. Oregon
Motor-vehicle theft rate in 2022: 540.9 incidents per 100,000 people
Total, known motor-vehicle thefts in 2022: 22,934 — 14th most of 50 states (2.3% of all U.S. car thefts)
Registered light-duty vehicles in state: 90.4 for every 100 people (3,832,700 total)
State population: 4,240,100 — 24th smallest of 50 states (1.3% of total U.S. population)
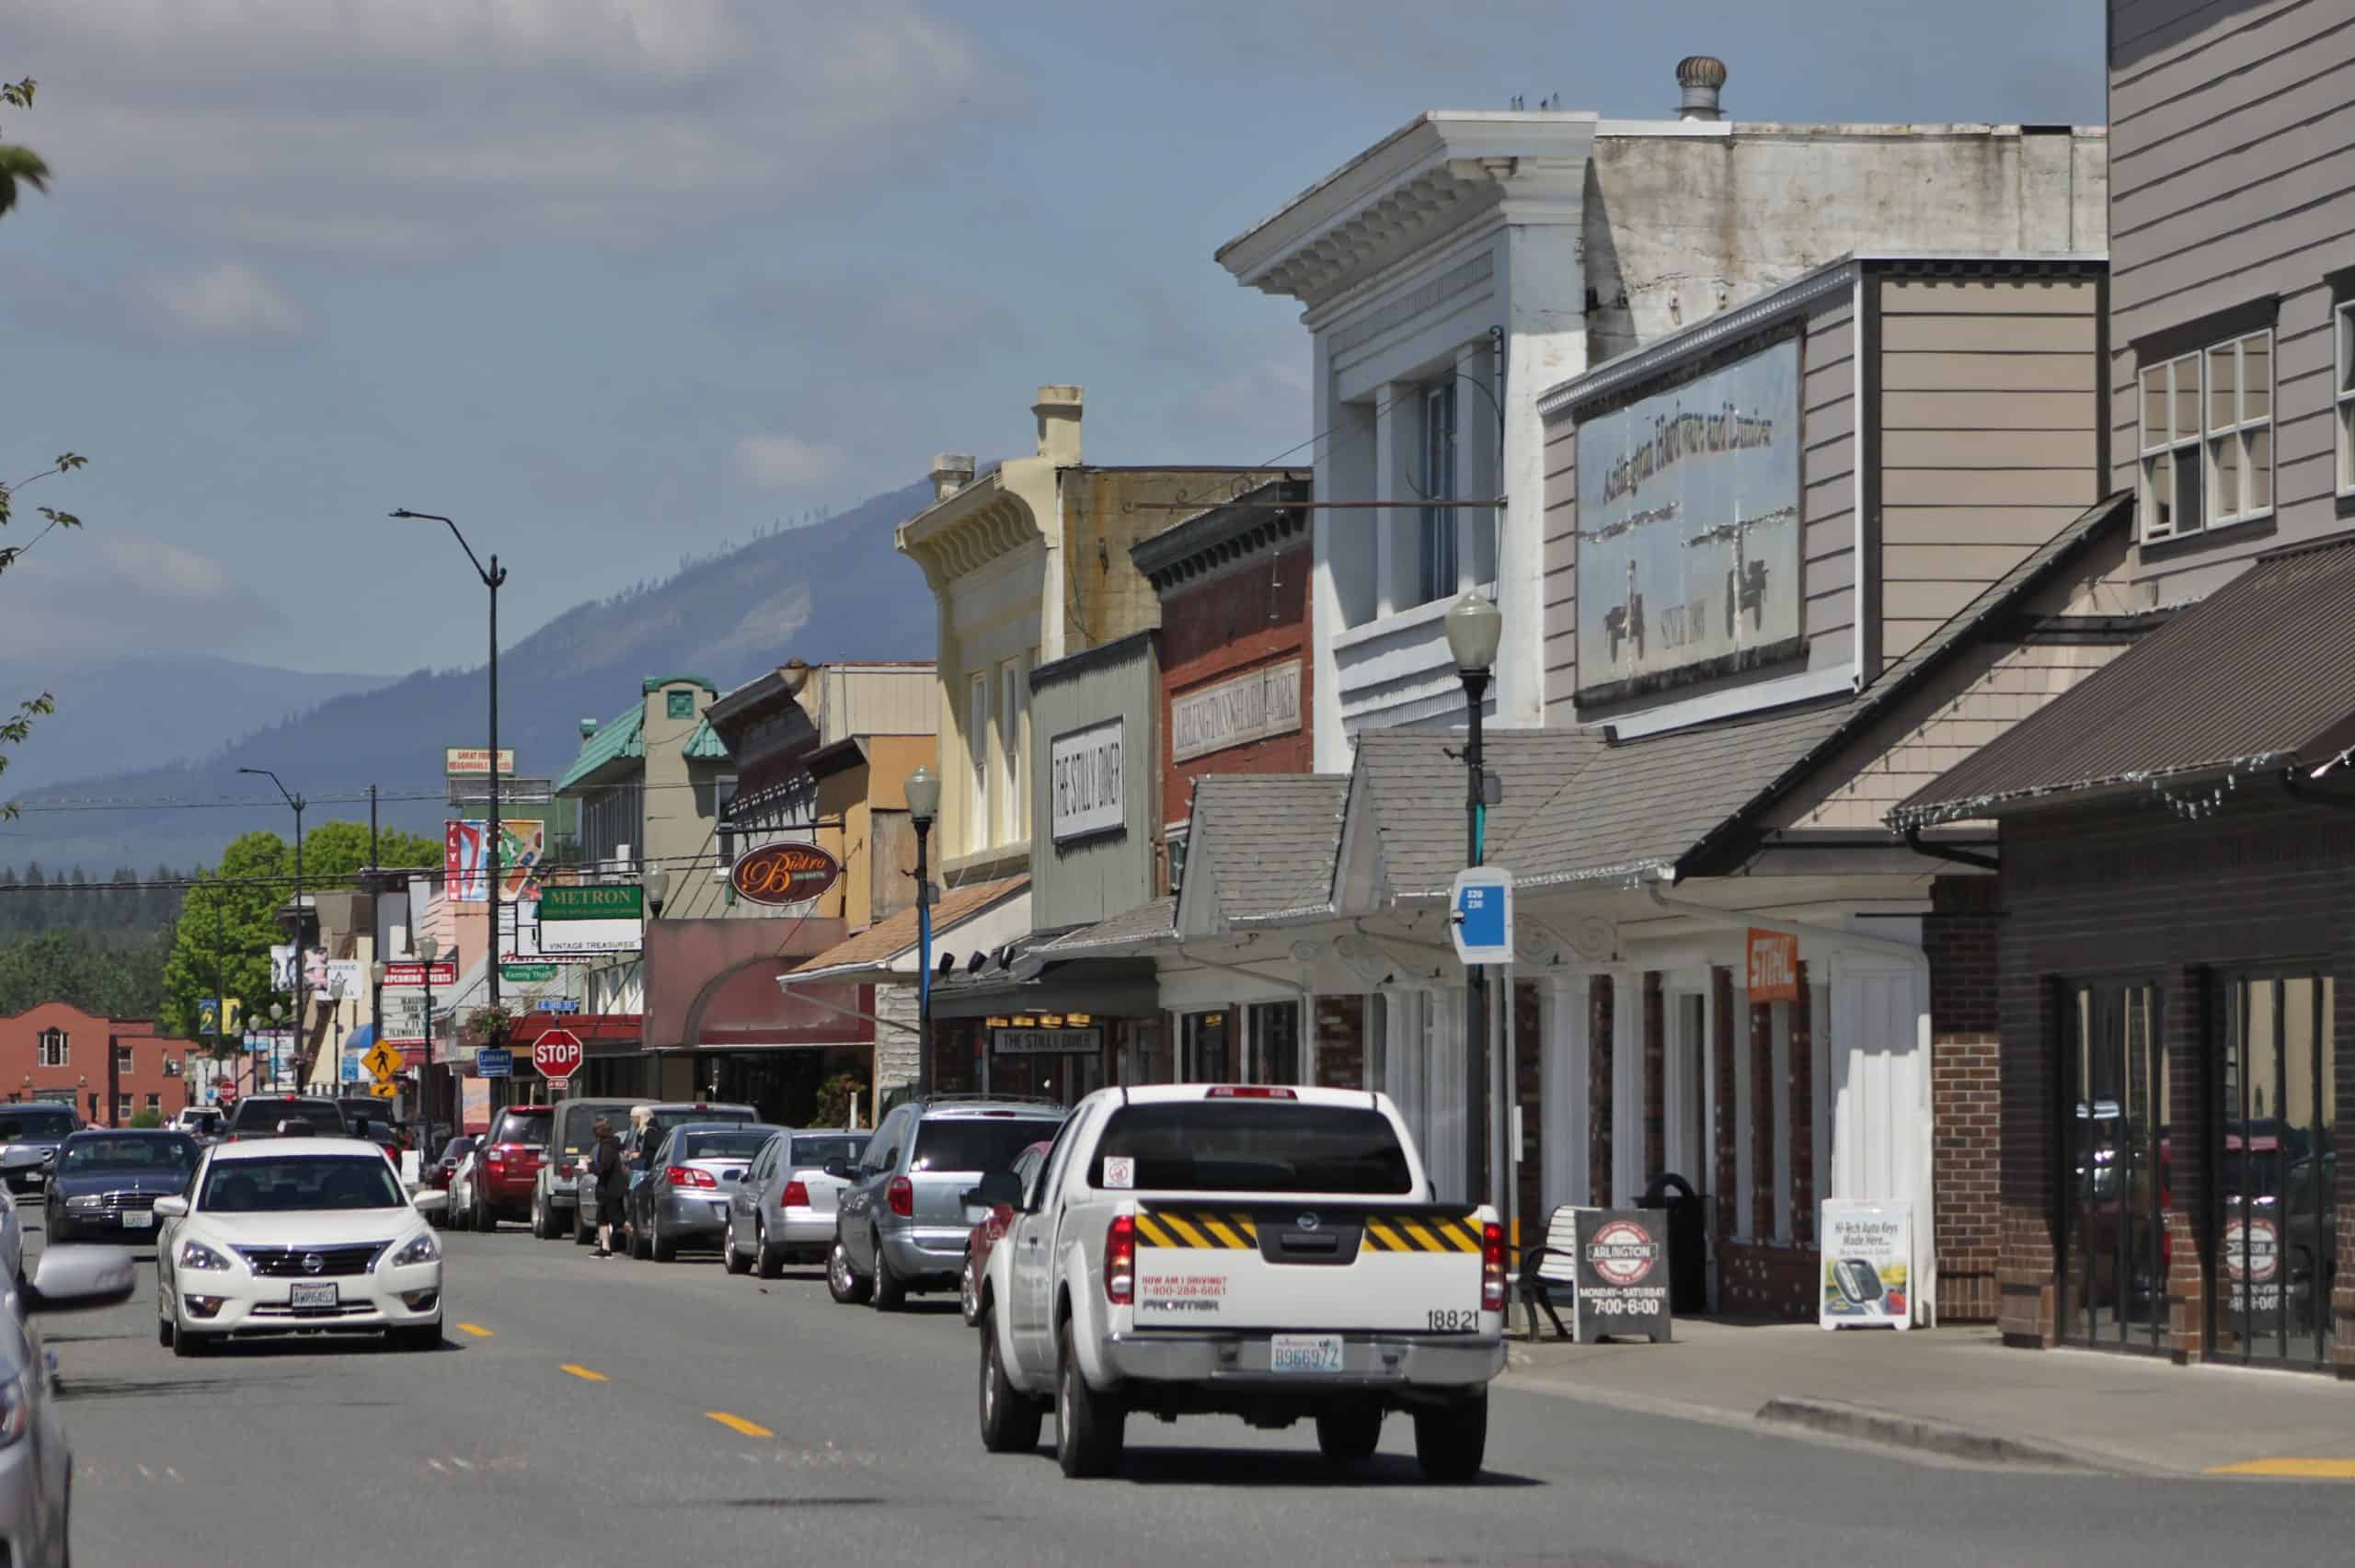
2. Washington
Motor-vehicle theft rate in 2022: 603.5 incidents per 100,000 people
Total, known motor-vehicle thefts in 2022: 46,990 — 3rd most of 50 states (4.7% of all U.S. car thefts)
Registered light-duty vehicles in state: 87.5 for every 100 people (6,816,100 total)
State population: 7,785,800 — 13th largest of 50 states (2.3% of total U.S. population)
1. Colorado
Motor-vehicle theft rate in 2022: 731.3 incidents per 100,000 people
Total, known motor-vehicle thefts in 2022: 42,706 — 5th most of 50 states (4.3% of all U.S. car thefts)
Registered light-duty vehicles in state: 93.2 for every 100 people (5,441,800 total)
State population: 5,839,900 — 21st largest of 50 states (1.8% of total U.S. population)